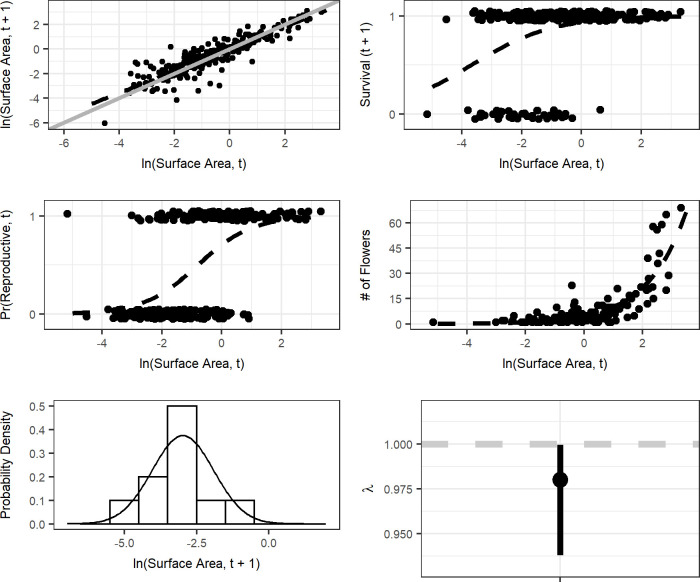
Fig 3. Vital rates models.
Results for ramet growth (a), survival (b), probability of flowering (c), flower production (d), and recruit size distribution (e), and per-capita population growth rate with 95% bootstrap confidence intervals (f). The dotted black lines in a-c, e and the solid black line in d are fitted relationships from the models described in Methods. In (a), the solid grey lines show a 1:1 relationship (i.e. no change in ramet size), and the dotted grey line in f denotes a per-capita population growth rate of 1 (e.g. population level stasis).

