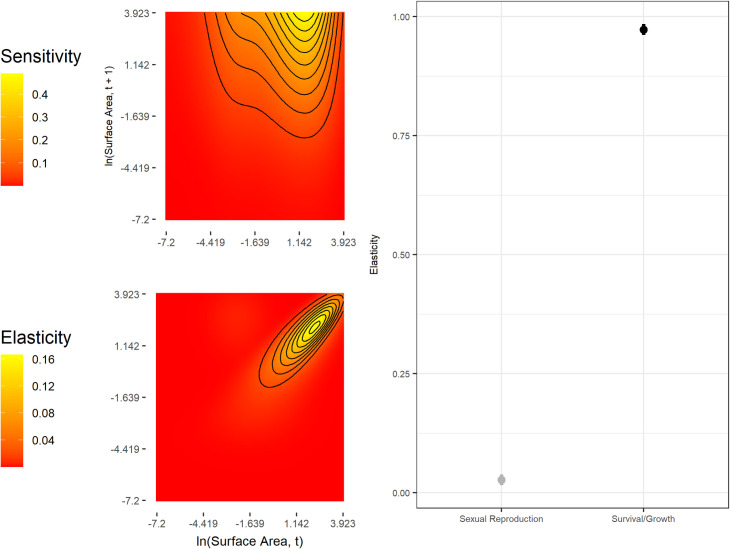
Fig 4. Sensitivity and elasticity functions of λ.
Left: Sensitivity and elasticity kernels for the complete model. Right: Elasticities for each sub-kernel, indicating relative contributions of each to the per-capita growth rate. The range line for each point estimate of the sub-kernel level elasticity shows the 95% confidence interval derived from the boot strapping procedure.

