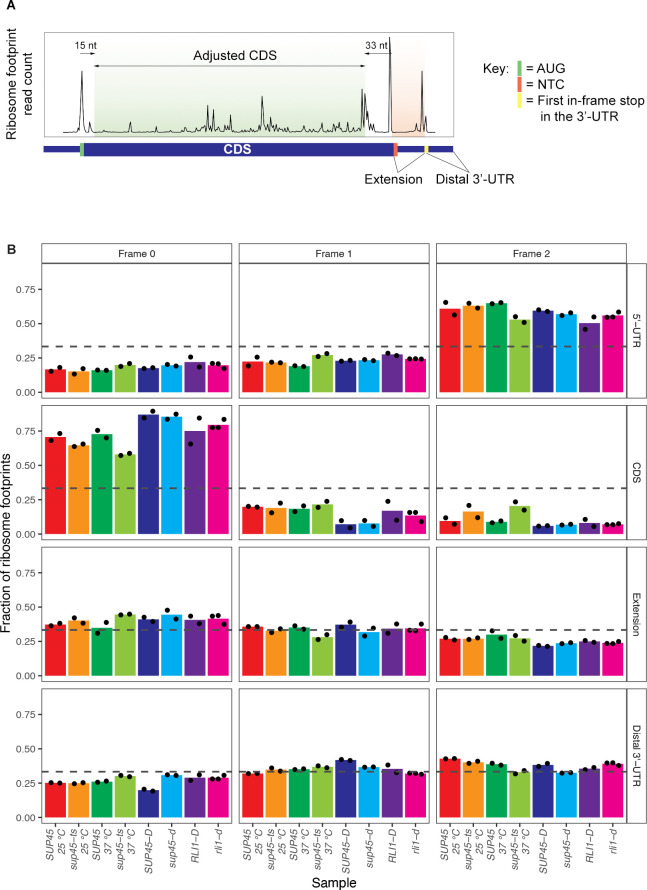
Fig 2. Readthrough events were characterized by maintenance of reading frame when ribosomes bypass the stop codon.
A. Example of ribosome footprint count plot with labeled mRNA regions of interest. B. Fractions of reads in each of the three reading frames for different mRNA regions. The results of each sample were the average of 2 or 3 replicates, with black dots indicating individual data points. The dashed line drawn at 0.33 is the theoretical fraction at which all 3 reading frames are represented in equal amounts.

