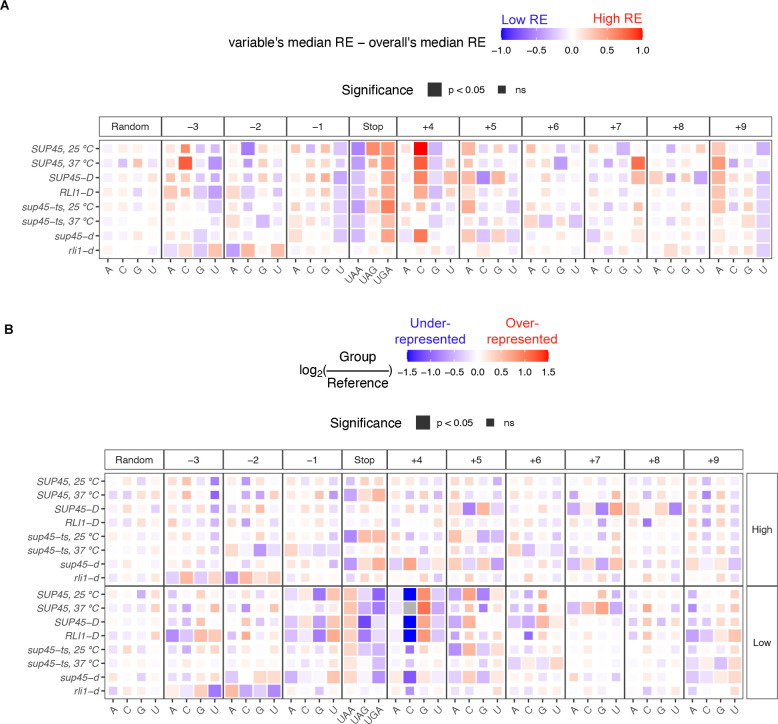
Fig 5. Known individual effects of stop codon and surrounding nucleotide identities on readthrough efficiency occur at a genome-wide level.
A. Heatmap of median readthrough efficiency of genes containing particular stop codon or nucleotide relative to median readthrough efficiency of all genes in the sample. Positive value (red) indicates that the group of genes had higher readthrough efficiencies compared to the sample median, while negative value (blue) indicates lower readthrough efficiencies. Wilcoxon’s rank sum test was used to determine whether the difference in group and sample media was significant. Significant difference was represented as a larger tile. B. Heatmap demonstrating over-representation (red) or under-representation (blue) of a stop codon or nucleotide in “High” or “Low” readthrough groups relative to the frequency in the reference gene set. χ2 goodness of fit test with Bonferroni correction was performed to compare usage distribution between the “High” readthrough group, “Low” readthrough group, and the reference. Significant difference was represented as a larger tile. Grey tiles signify that there was zero observation of that nucleotide (essentially under-represented), and log2 calculation and statistical analysis could not be performed.

