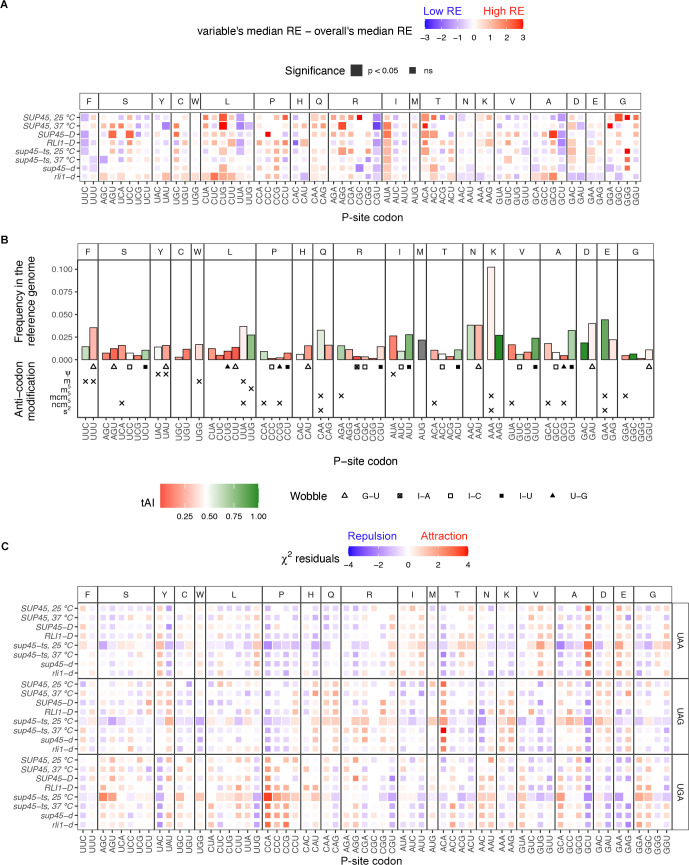
Fig 7. Specific codons in the P site were associated with higher or lower readthrough efficiencies.
A. Heatmap of median readthrough efficiency of genes containing a particular triplet codon in the ribosomal P site. Positive value (red) indicates that the group of genes had higher readthrough efficiencies compared to sample median, while negative value (blue) indicates lower readthrough efficiencies. Wilcoxon’s rank sum test was used to determine whether the difference in group and sample media was significant. Significant difference was represented as a larger tile. B. General information regarding the P-site codons. The Y-axis shows frequency of codon usage in the P site among the reference gene set. Color of the bar represents tRNA adaptation index (tAI), a measurement for codon optimality where 0 is non-optimal and 1 is optimal [48,49]. Below the bar plots are wobble pair information and anti-codon modifications. C. Heatmap showing residuals of χ2 test of independence between stop codon and P-site codon identities. Significant values (p < 0.05), represented by larger tile size, indicate the significant association between stop codon and P-site codon identities. Positive (red) residuals specify positive association (attraction) and negative (blue) residuals negative association (repulsion) between variables. Interpretation of the results should be done with caution as the analysis suffered from small sample size.

