
Fig 3. During the latter treatment phases, intravenous folinic acid administration reduced the highly elevated CSF levels of Tau (but not pTau) in methylenetetrahydrofolate reductase (MTHFR) MTHFR1298CC individuals.
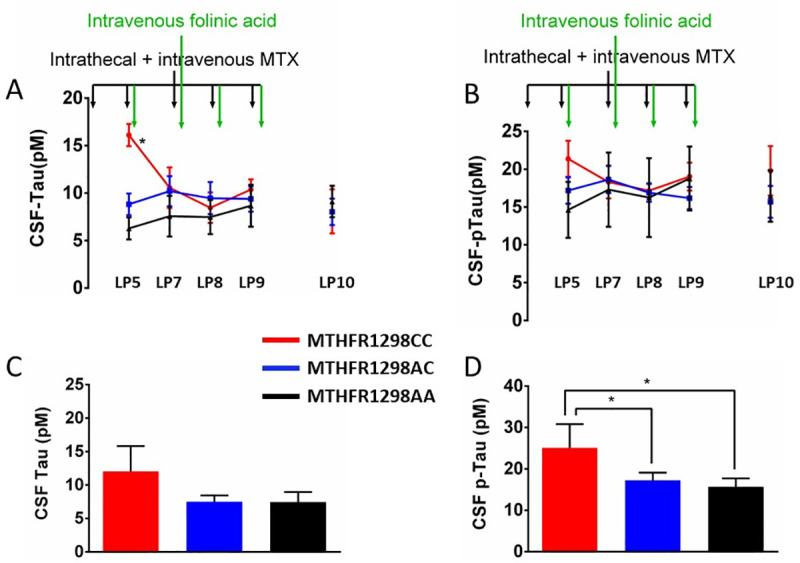
Methotrexate (MTX) treatment was continued (black vertical arrows at the top of each figure). Panels A-B depict CSF Tau (A) and pTau (B) levels during the interval and reinduction phases (lumbar puncture, LP6-10). Initially elevated CSF Tau (but not pTau) levels (LP6), equalized after intravenous folinic acid administration (LP7-10, green vertical arrows). Panels C-D depict CSF biomarker levels during the maintenance phase. CSF pTau differed significantly between genotypes (D), whereas Tau did not (C). MTHFR genotype is indicated with color in all panels (red: MTHFR1298CC, blue: MTHFR1298AC, black: MTHFR1298AA). Appropriate ANOVA was followed by post-hoc LSD with * p < 0.05; ** p < 0.010; *** p< <0.001.