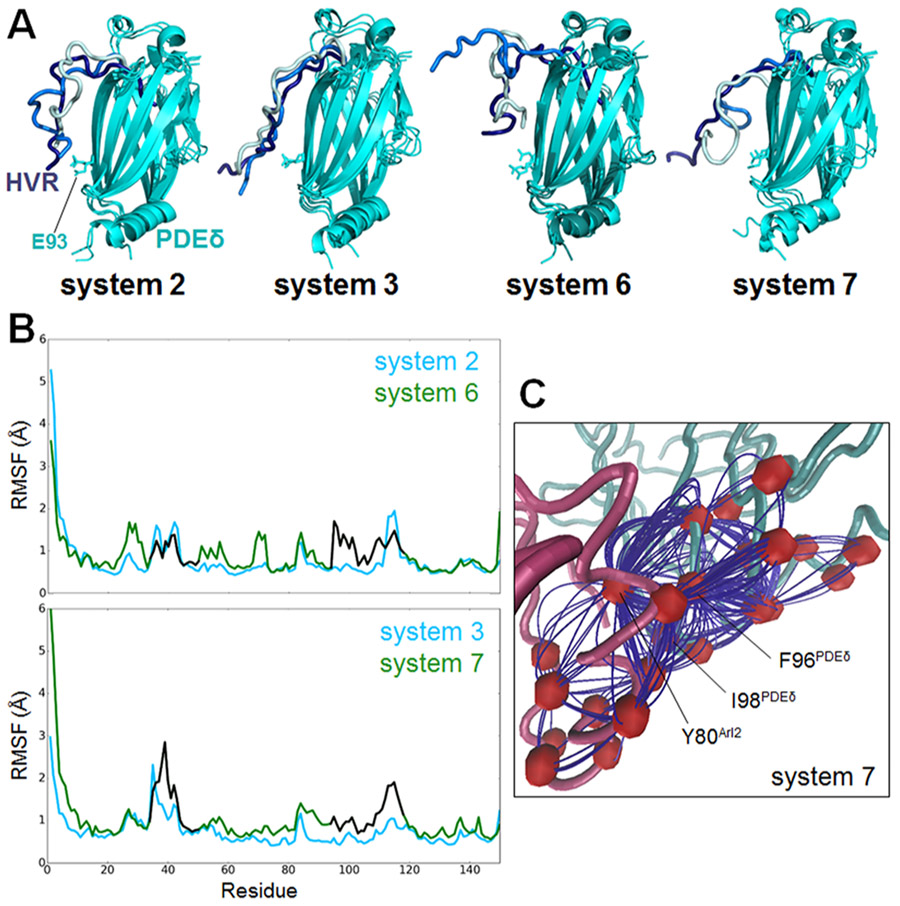
Figure 5.
Allosteric changes in PDEδ induced by Arl2–GTP. (A) Position of KRas4B HVR in systems 2 and 3 with Arl2–GDP and in systems 6 and 7 with Arl2–GTP. The cyan molecules are superimposed PDEδs. The dark blue, blue, and light blue tubes represent the HVR conformations at 10, 150, and 500 ns, respectively. (B) RMSF plots of PDEδ in systems 2 and 6 (upper panel) and systems 3 and 7 (lower panel). The blue lines cover residues of systems 2 and 3, and the green lines cover residues of systems 6 and 7. The residues between 33–50 and 93–118, which are used in WISP analysis, are represented with black lines in systems 6 and 7. (C) Allosteric pathway between the selected residue pair on Arl2 and PDEδ, Tyr80Arl2/Ile98PDEδ, in system 7 with Arl2–GTP.

