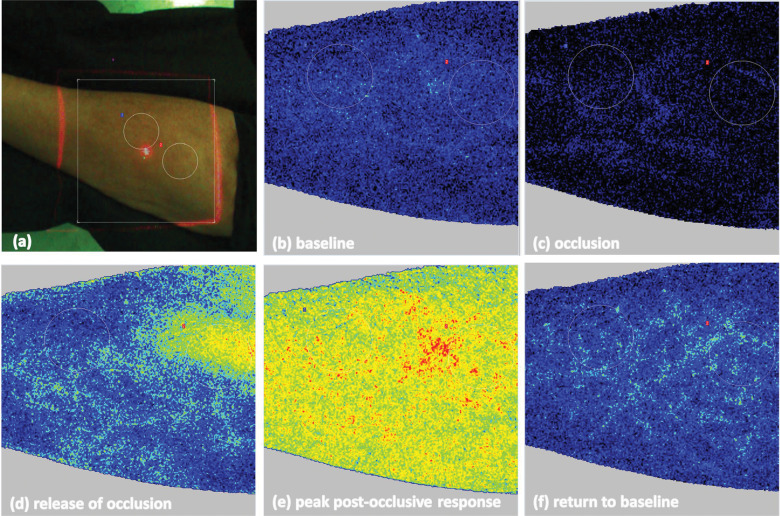
FIGURE 2:
(A) ROIs for LSCI measurements in the patient’s forearm marked with white circles. Images (speckle pattern) obtained during different phases of the exam: (B) baseline, (C) occlusion, (D) release of occlusion, (E) peak post-occlusive hyperaemic response and (F) return to baseline perfusion after peak response.

