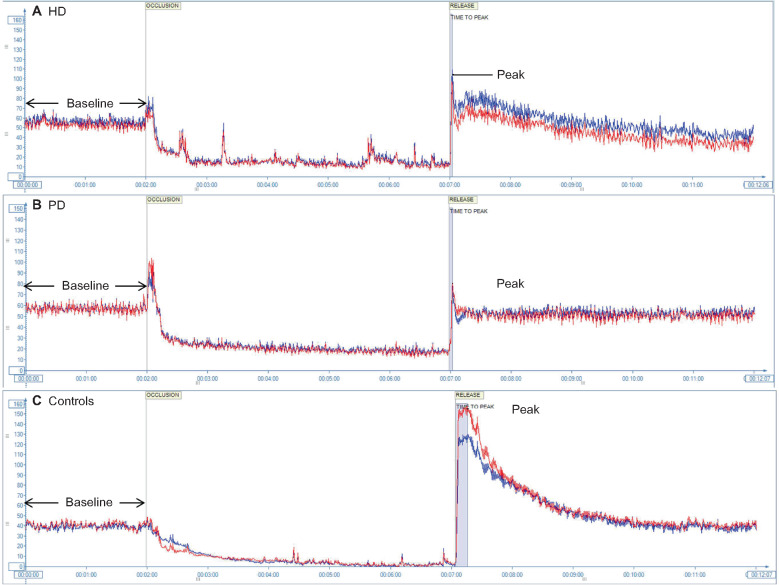
FIGURE 3:
Depiction of changes in perfusion units across time during a typical exam performed using LSCI coupled with a PORH challenge in (A) an HD patient, (B) a PD patient and (C) a control. The blue and red lines represent the two circular sites (ROIs) that were evaluated in each patient. Characteristic findings are the lower time to peak and decreased post-occlusion peak perfusion in ESRD patients.

