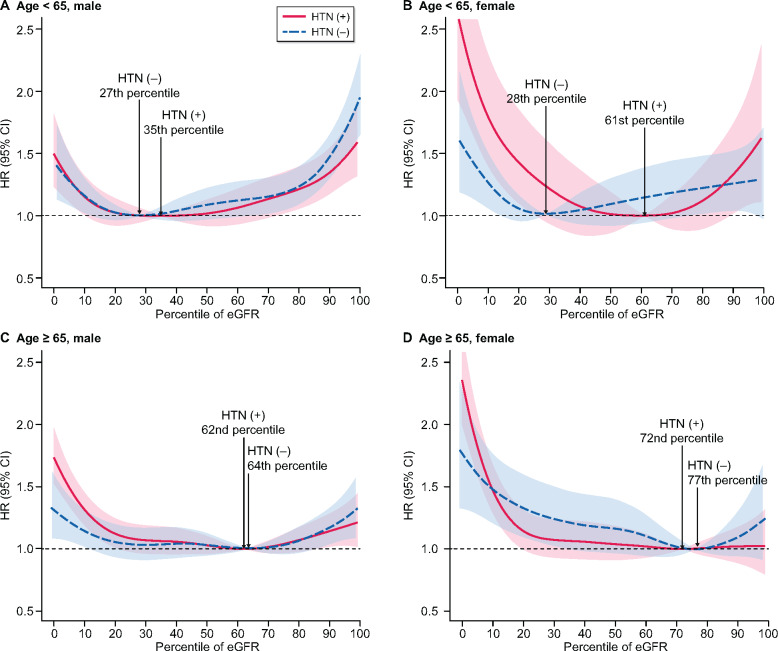
FIGURE 4:
All-cause mortality according to eGFR percentile among patients with and without hypertension in (A) the middle-aged male, (B) the middle-aged female, (C) the older-aged male and (D) the older-aged female groups. The red line represents the hypertensive group and the blue dotted line represents the normotensive group. The minimum-mortality eGFR percentile is indicated by the upward dotted line labeled with the specific value in each group. Adjusted variables were age, sex, BMI, systolic blood pressure, smoking status, drinking status, serum glucose and total cholesterol

