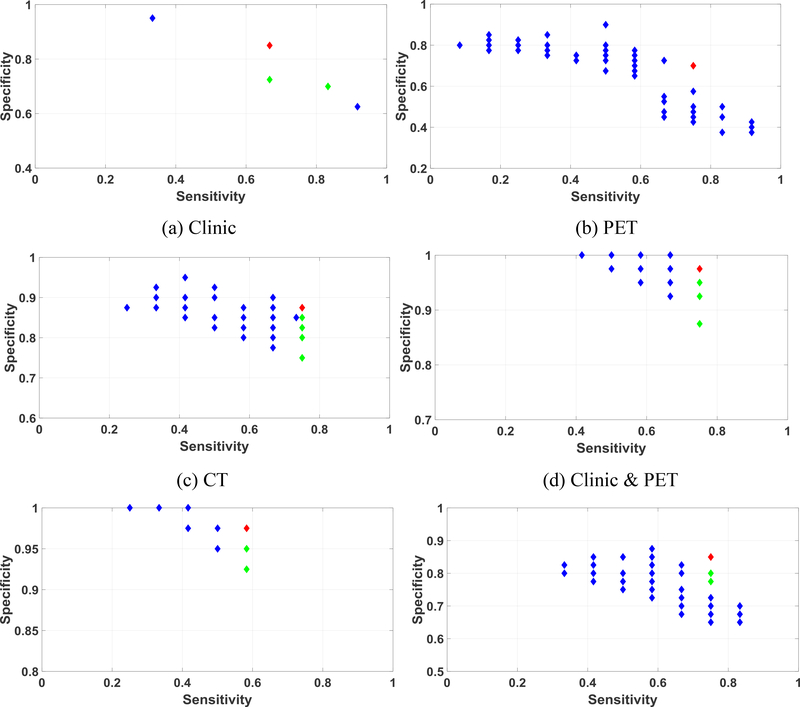
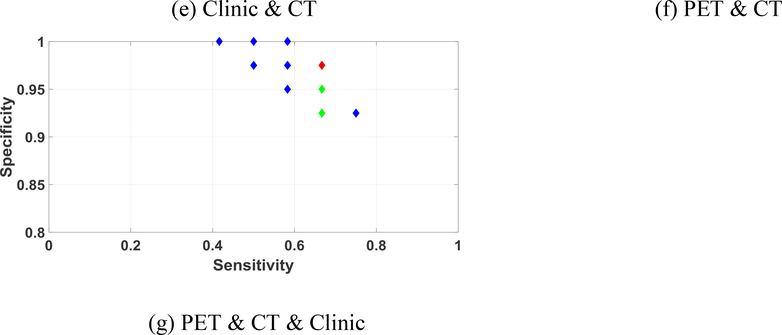
Figure 8.
Pareto-optimal solution set and best solution selection for TMIA using different combinations of the feature sets. Red label: final selected solution; Green labels: selected feasible solutions; Blue labels: unselected solutions. Note that the ranges of the x and y axes are different in each figure.


