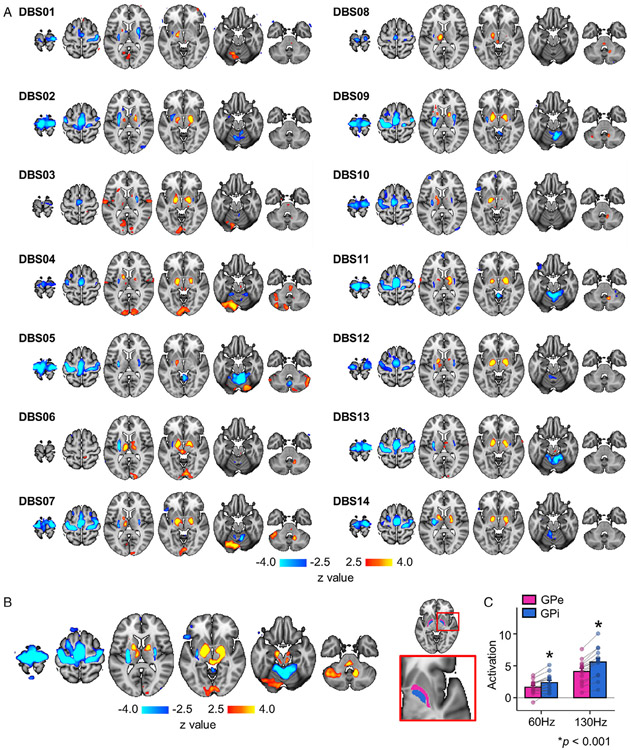
FIGURE 3:
Individual-level and group-level brain responses to subthalamic nucleus (STN) deep brain stimulation (DBS). (A) Responses induced by STN-DBS were estimated for each patient and overlaid onto a Montreal Neurological Institute brain template. For each patient, blood oxygen level–dependent signals corresponding to low- and high-frequency stimulation at the 1-, 3-, 6-, and 12-month follow-up treatment visits were processed by a fixed effects model. Activated regions are shown in yellow/red, and deactivated regions are shown in blue. (B) Group-level activation map was derived from a random effects linear mixed model. (C) For each patient, the magnitude of activation intensity was quantified for the globus pallidus externus (GPe; pink) and globus pallidus internus (GPi; blue; right panel). Bar graph indicates that STN-DBS–induced activation in the GPi was significantly greater at both high-frequency (130Hz) and low-frequency (60Hz) levels compared to the GPe (p < 0.001).

