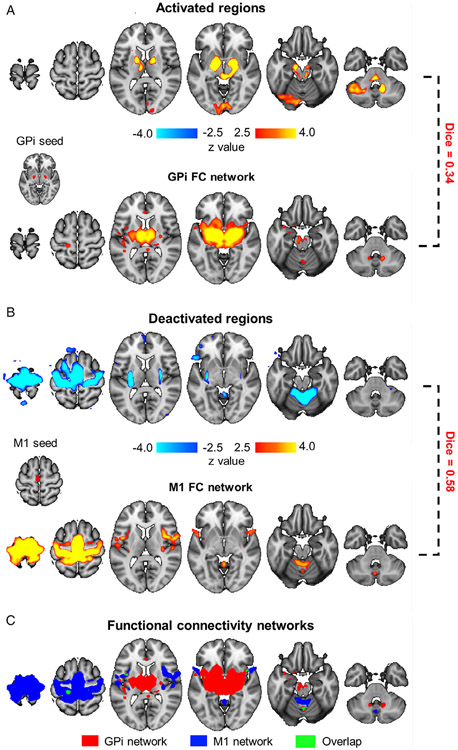
FIGURE 4:
Activated and deactivated regions represent 2 distinct functional pathways. (A) Group-level responses to subthalamic nucleus (STN) deep brain stimulation (DBS) showed strong activation in the globus pallidus internus (GPi), thalamus, and cerebellum (top panel). Activation peaks in the bilateral GPi (z > 7.0) were used as seeds (Montreal Neurological Institute [MNI] coordinates [x, y, z]: right GPi [21, −6, −1], left GPi [−17, −7, −3]), and their functional connectivity (FC) to the whole brain was estimated using presurgical resting-state functional magnetic resonance imaging data. GPi showed strong connectivity to the thalamus and deep cerebellar nuclei (bottom panel). Regions functionally connected to the GPi and regions activated by STN-DBS showed a Dice overlap of 0.34. (B) Group-level response to STN-DBS showed strong deactivation in primary motor cortex (M1), putamen, and cerebellum (top panel). Deactivation peaks in M1 (z < −7.0) were used as a seed region (MNI coordinates [x, y, z]: [−3, −17, 62]), and FC to the whole-brain was estimated (bottom panel). Regions functionally connected to M1 and regions deactivated by STN-DBS showed a Dice overlap of 0.58. (C) FC maps from A and B were overlaid onto a single map. Regions connected to the GPi (red) showed minimal overlap (green) with regions connected to M1 (blue), with Dice coefficient = 0.05.

