
Fig. 3.
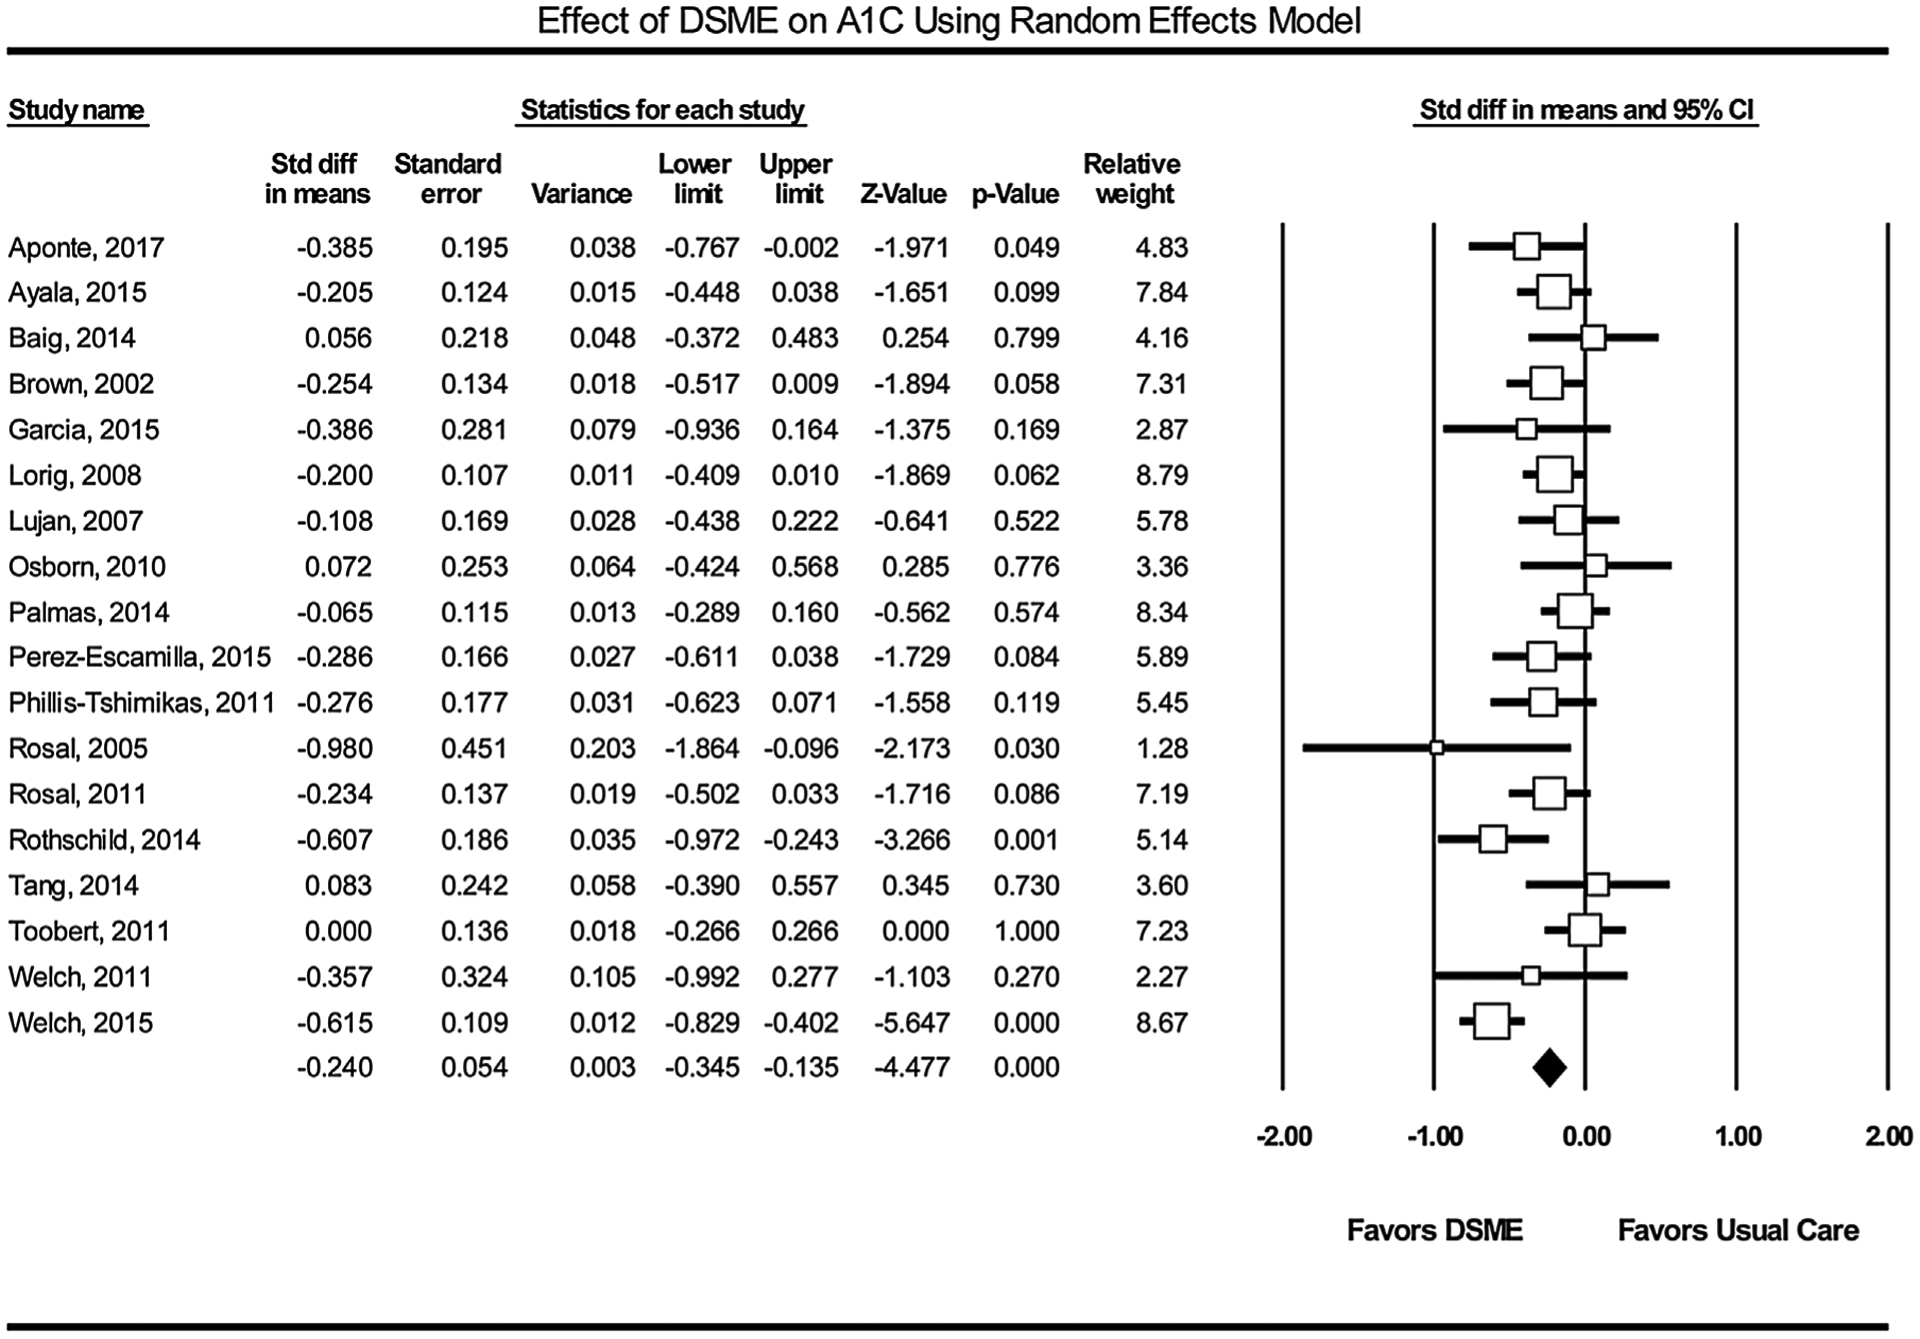
The forest plot of the mean difference of A1C reduction in study participants. Squares represent effect sizes of individual studies with extended lines denoting 95% confidence interval. Sizes of squares indicate the weight of each study based on the sample size using random effects analysis. The diamond represents the estimated pooled effect size. A ratio of estimates below zero indicates the beneficial treatment effect of DSME.