
Fig. 4. NLRX1-dependent up-regulation of OXPHOS in HIV-1-infected T cells.
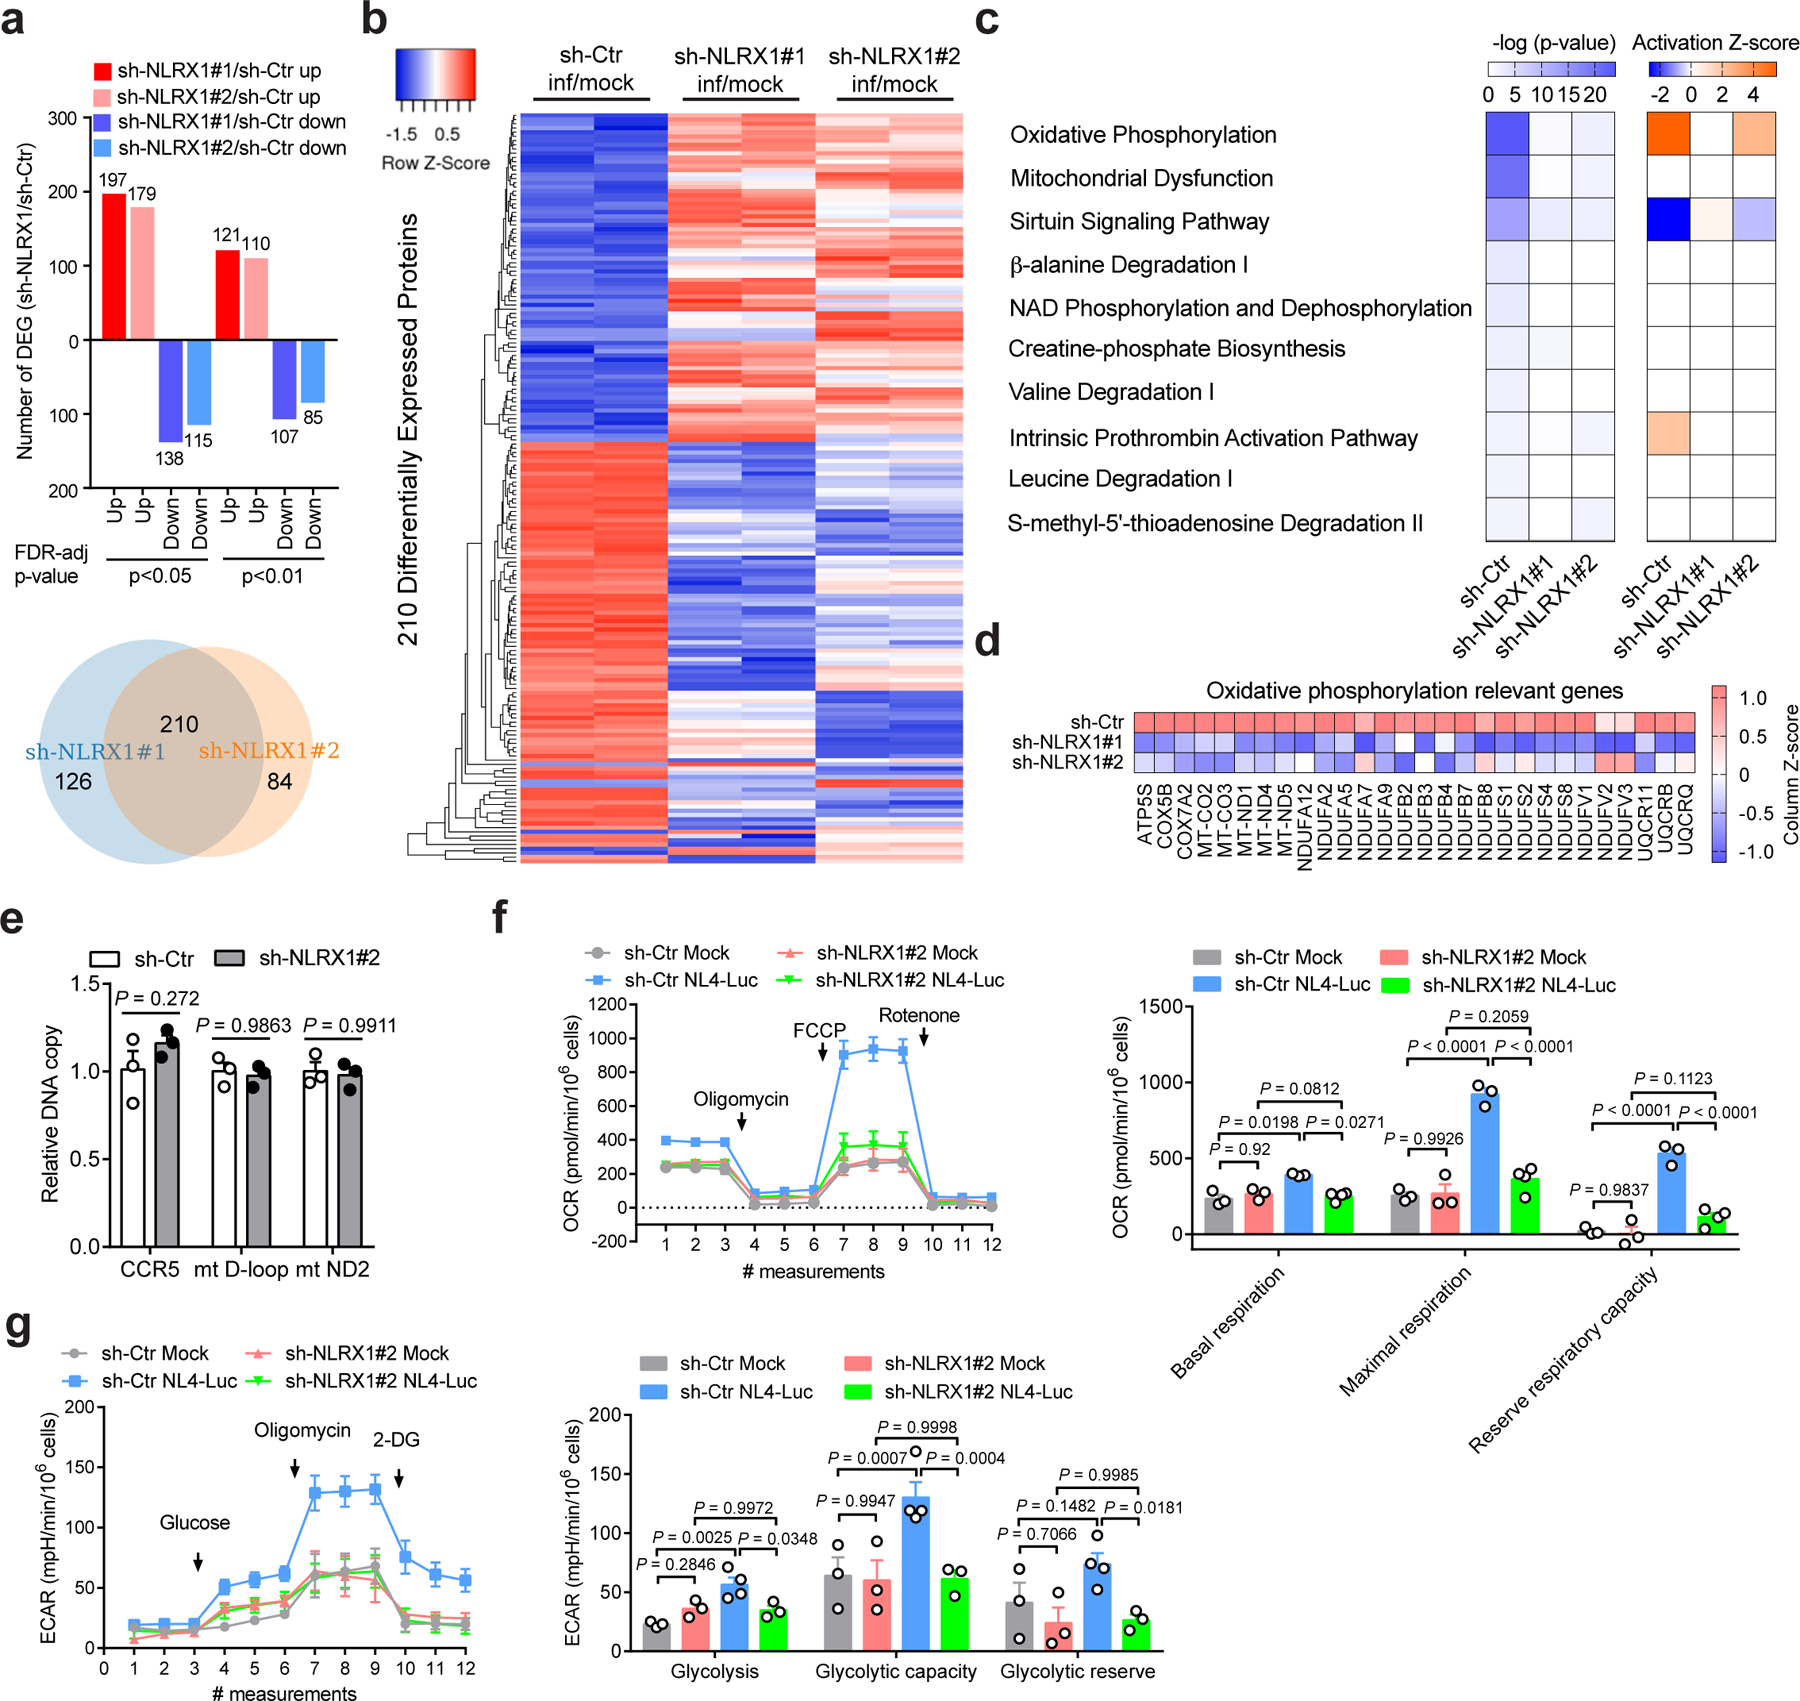
a, Upper panel: Bar diagrams represent numbers of upregulated and downregulated proteins in VSV-G-NL4–3-Luc-infected Jurkat-sh-NLRX1 compared to Jurkat-sh-Ctr at indicated levels of FDR-adjusted significance. Lower panel: Venn diagram shows the number of upregulated and downregulated proteins (sh-NLRX1/sh-Ctr) co-identified using two different NLRX1 shRNA-transduced Jurkat cells. Two hundred and ten co-identified proteins were used to plot the heatmap.
b, Heatmap comparing the differentially expressed proteins between Jurkat-sh-Ctr and Jurkat-sh-NLRX1#1 and Jurkat-sh-NLRX1#2 cells infected with VSV-G-NL4–3-Luc. Samples were run in biological duplicates. c, Predicted canonical pathways of differentially expressed proteins (infection/mock, fold change ≥ 2), based on Ingenuity Pathway Analysis. The left panel: P-value; the right panel: activation Z-score.
d, Expression change of proteins involved in the OXPHOS pathway (infection/mock).
e, The measurement of nuclear and mitochondrial DNA content in Jurkat cells containing sh-Ctr or sh-NLRX1. sh-Ctr was set as 1. For each gene region, n = 3 cell cultures per experiment.
f, g, The oxygen consumption rate (OCR, f) and extracellular acidification rate (ECAR, g)in Jurkat-sh-Ctr or Jurkat-sh-NLRX1 cells infected with VSV-G-NL4–3-Luc (NL4-Luc) or left uninfected (mock). Each dot represents one cell culture.
Data are the pool (a, b) or mean (c, d) of two biological replicates. Data (e–g) are representative of three independent experiments shown as the mean ± s.e.m. Statistical significance was tested by two-way ANOVA followed by Sidak’s (e) or Tukey’s (f, g) multiple comparisons test.