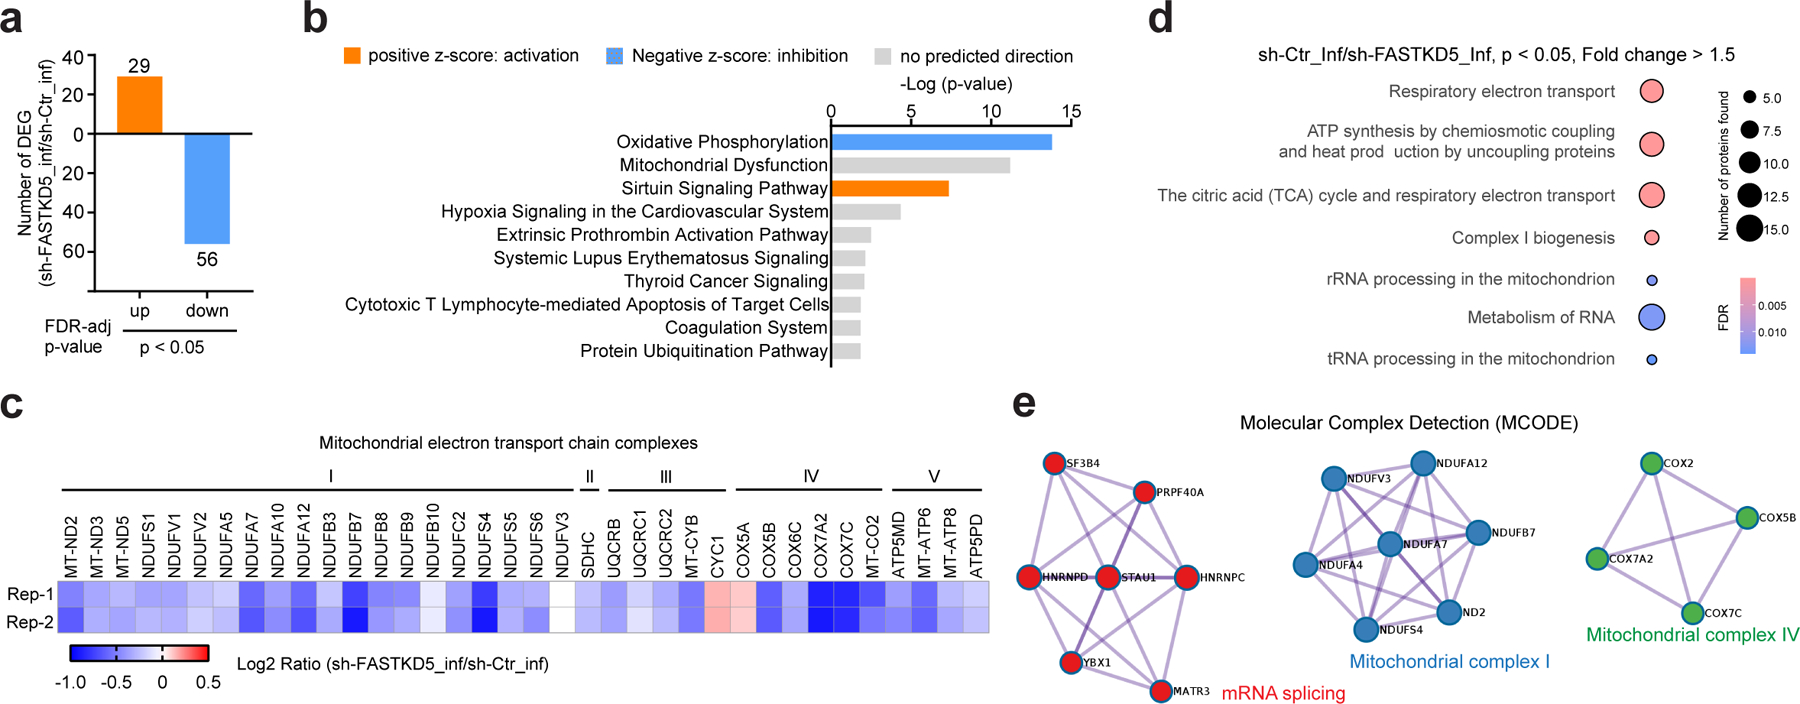
Fig. 7. FASTKD5 upregulates electron transport chain components upon HIV-1 infection.

a, Characterization of FASTKD5-regulated protein expression by tandem mass tag (TMT) based quantitative mass spectrometry. Bar diagrams represent numbers of upregulated and downregulated proteins in VSV-G-NL4–3-Luc-infected Jurkat cells induced by doxycycline to express shRNA against FASTKD5 (sh-FASTKD5) compared to un-induced Jurkat cells (sh-Ctr) at indicated levels of FDR-adjusted significance. The mean value of two biological replicates was used to calculate the fold change (FC, sh-FASTKD5/sh-Ctr). Proteins with ∣FC∣ > 1.5 and FDR < 0.05 were identified as differentially expressed proteins.
b, Predicted canonical pathways of differentially expressed proteins based on Ingenuity Pathway Analysis. Top 10 enriched pathways based on P-value were plotted. Positive Z-score indicating activation was presented as orange color, and negative Z-score indicating inhibition was presented as blue.
c, Heatmap presenting changes in the expression of proteins in mitochondrial electron transport chain complexes (sh-FASTKD5/sh-Ctr, VSV-G-NL4–3-Luc infection). Samples were run in biological duplicates. P-value < 0.05 was used as the filter.
d, ReactomeFI network analysis of proteins downregulated in panel a. Circle size represents the number of proteins found in the pathway, and color shows the FDR for enrichment. Pathways with FDR < 0.05 were plotted.
e, Molecular Complex Detection (MCODE) analysis of proteins downregulated in panel a was performed by Metascape.
