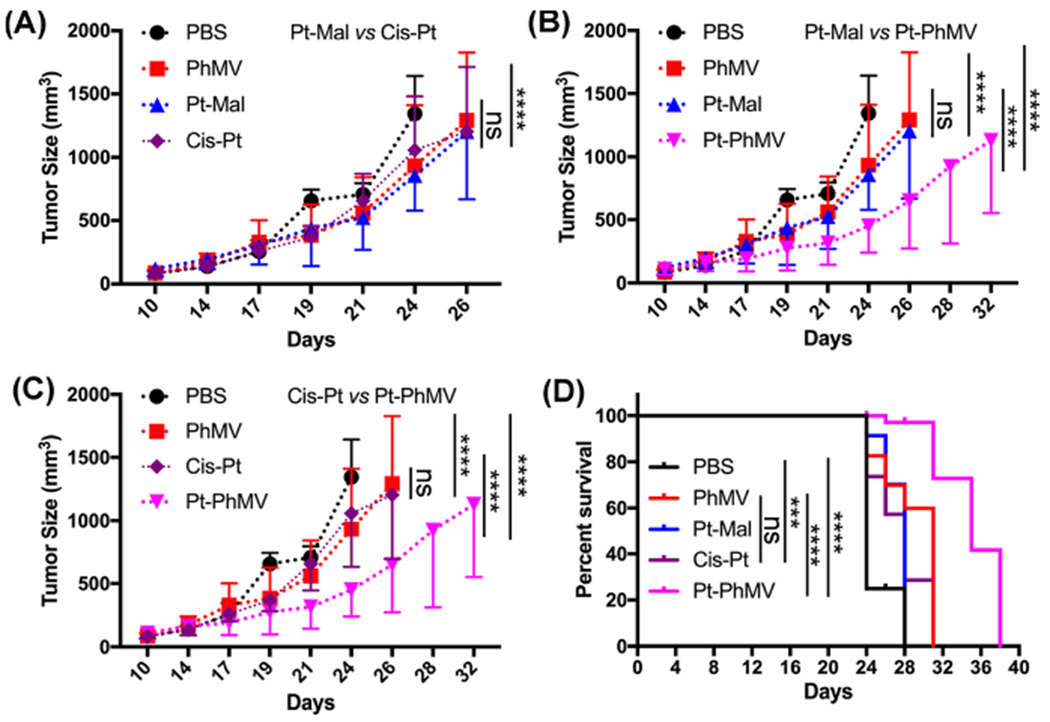
Figure 4.

Inhibition of tumor growth in an athymic mouse model (n = 10) with MDA-MB-231 xenografts after treatment with different formulations. The treatment began when tumors reached a volume of ~150 mm3 and involved a twice-weekly intravenous bolus of 1.0 mg Pt/kg in the form of cisplatin (cis-Pt), Pt-Mal, or Pt-PhMVCy5.5-PEG (Pt-PhMV). PBS or PhMVCy5.5-PEG (PhMV) particles were administered as controls, with PhMVCy5.5-PEG particle dosage normalized to Pt-PhMVCy5.5-PEG. Tumor volumes and body weight were measured before each injection. Statistical analysis was carried out by two-way ANOVA. Mean tumor volumes and standard errors of the mean are shown. (A) Pt-Mal vs cis-Pt, (B) Pt-Mal vs Pt-PhMV, and (C) cis-Pt vs Pt-PhMV. (D) Statistical analysis for survival curves: log-rank (Mantel–Cox) test. ns = no statistical significance, ***: p < 0.001, ****: p < 0.0001.
