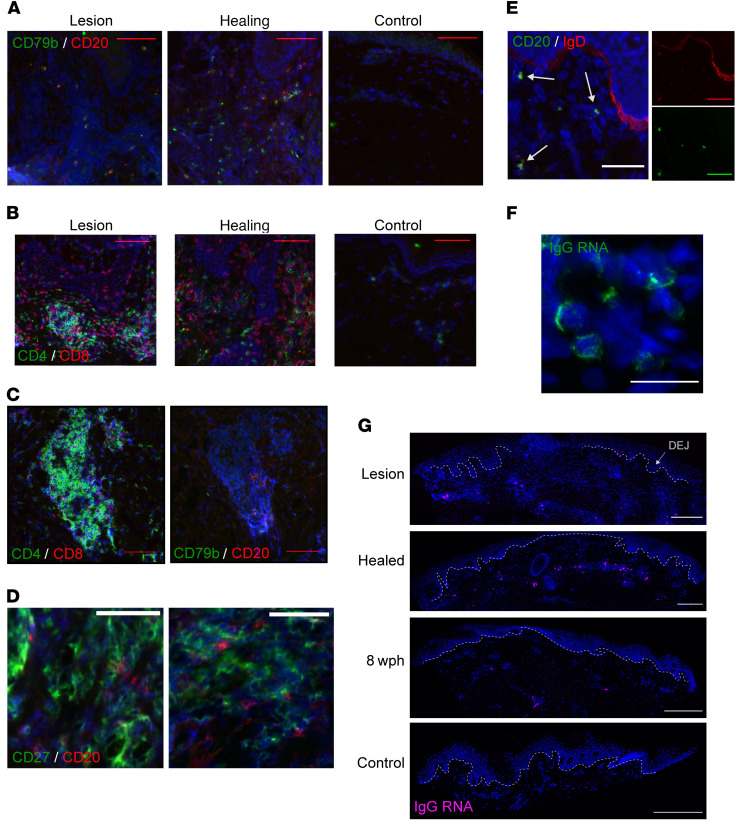
Figure 1. Antigen-naive CD20+ B cells and IgG RNA+ cells infiltrate lesion-area skin but not uninvolved skin during HSV-2 reactivation.
(A) B cells: CD20 (red) and CD79b (green) in serial genital skin biopsy samples taken during and after HSV-2 lesion from a single participant (results shown for 1 of 10 patients). No B cells were detected in the control sample. (B) T cells: CD4 (green) and CD8 (red) in serial specimens taken during and after HSV-2 reactivation (result shown for 1 of 8 patients). Scale bars: 100 μm. (C) Densely clustered CD4+CD8+ T cells (left) in this participant were accompanied by CD20+CD79b+ B cells (right); scale bars: 50 μm. (D) CD27 (green) and CD20 (red) in a lesion sample with no evidence of costaining (result shown for 1 of 6 patients); scale bars: 50 μm. (E) In a healing-skin specimen, B cells express CD20 (green) and IgD (red) (result shown for 1 of 5 patients). Arrows indicate sites of coexpression. Inset shows red and green channels separately. Scale bars: 50 μm. (F) IgG-producing cells are loaded with IgG RNA by FISH. IgG mRNA (green) in a healing specimen of HSV-2 reactivation (result shown for 1 of 9 patients). Original magnification, 40× by oil immersion. Scale bar: 25 μm. (G) IgG+ cells by FISH over time, showing distribution within the upper dermis and lymphocyte clusters. In this participant, the control specimen (from the arm) had no IgG+ cells. Dashed line indicates the DEJ. Images obtained at 20×; scale bars: 250 μm. Brightness in G was increased for consistency. wph, weeks after healing.

