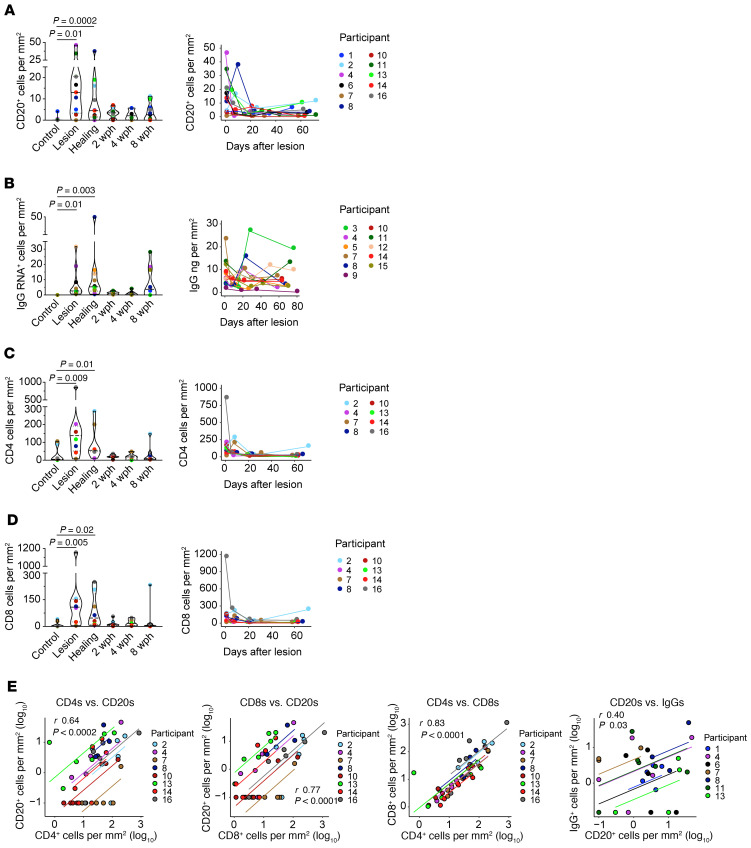
Figure 4. Migration kinetics of B and T cells into genital skin during HSV-2 reactivation and tissue healing by type of biopsy and over time.
Density of (A) CD20+ cells by IF (n = 11), (B) IgG RNA+ cells by FISH (n = 10), (C) CD4+ T cells by IF (n = 8), and (D) CD8+ T cells by IF (n = 8) in tissue at the biopsy time points (left panels) and by participant over time (right panels). Statistical testing was by Friedman’s test with Dunn’s corrections for multiple comparisons. Each graph on the right presents cell counts from genital-area biopsies over time, as measured from the identified symptomatic lesion. (E) Correlation (r) between B and T cell subsets and between CD20+ and IgG RNA+ cells was calculated by repeated-measure correlation. Participants are labeled by color; results for multiple specimens from genital and control areas from each participant are included in each graph.

