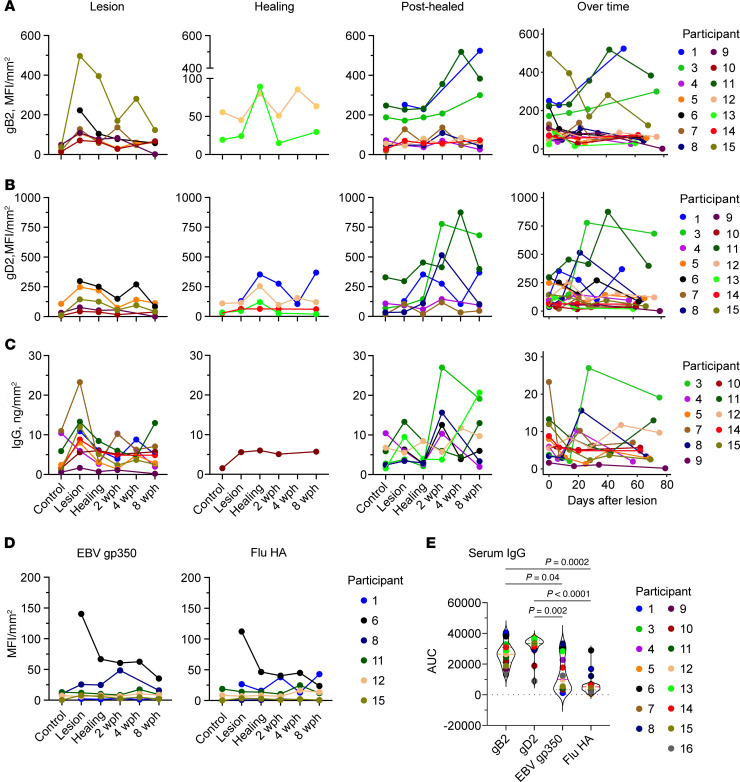
Figure 6. Levels of HSV-2–specific antibody and total IgG follow B cell and ASC density.
Concentration (expressed as MFI normalized to biopsy surface area [mm2]) of IgG to (A) gB2 (n = 14), (B) gD2 (n = 14), (C) total IgG (measured in ng/mm2; n = 13), and (D) control antigens EBV gp350 and Flu-HA (n = 6) in tissue over time and shown by participants, with antibody peak at lesion (first column) or healing (second and third columns) time points. If a person did not have a clear peak at one time point, they were included in multiple graphs. Levels of antibody over time (by number of days after lesion biopsy) are in the fourth column. Missing data points (such as the arm control in participant 6) correspond to specimens with insufficient tissue to run the test. (E) Area under the titration curve in a serum measurement of antibody specific to each of these antigens from a single sample taken from each person at study entry (n = 15). Serum titration curves are in Supplemental Figure 4, and AUC values are in Supplemental Table 2. Statistical testing was by Friedman’s test with Dunn’s corrections for multiple comparisons. All measurements were performed in duplicate.

