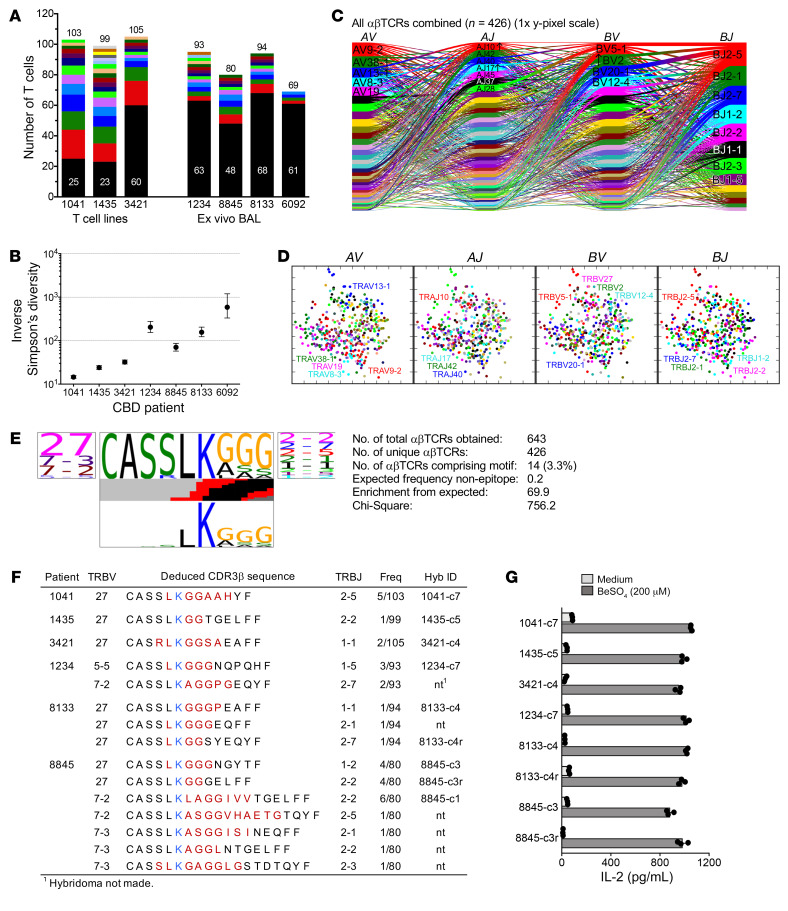
Figure 1. Identification of Be-specific BAL-derived T cells that express a CBD-related CDR3β motif.
(A) Stacked bar representation of clonality found by single-cell TCR analysis of CD4+ T cells from CBD patients. Black portions of bars proportionately count unique clonotypes; colored portions enumerate αβTCR-defined clonal expansions with height proportional to the number of cells in the expansion. Total αβTCR pairs obtained for each patient are indicated. (B) Inverse Simpson’s diversity plot of clone-size distributions. Displayed are means with upper and lower limits. (C) Cord diagram of T cell TR gene usage from CBD patients. Each individual T cell’s TR gene usage profile is connected by a curved line whose thickness is proportional to the number of T cells with the respective gene pairing. Genes are color coded based on frequency of usage, and enrichment of some genes relative to a background naive repertoire is indicated by arrows. (D) Two-dimensional PCA of TCRdist values for αβTCRs from all patients combined. Each dot represents a T cell, and color indicates usage of different TR genes. (E) TCR logo of CDR3β amino acid sequence motif identified in BAL-derived CBD T cells. Statistical significance was determined by χ2 analysis comparing the observed frequency of this motif versus the expected frequency. Panels show by proportion TRBV (left) and TRBJ (right) gene usage and encoded amino acid sequences (middle, top), respectively. Colored bars in the middle indicate the inferred nucleotide source for the corresponding position (black, TRD gene; red, N-insertions). Bottom panel summarizes the likelihood of each amino acid residue being non–germline derived (taller is more likely). (F) TRB gene usage and junctional region amino acid sequence of T cells comprising the LKGGG CDR3β motif cluster. Red (and blue [K]) colors indicate nongermline or TRBD gene–encoded amino acids. Also shown are the number of identical TCRs over the total number of sequences obtained for each patient and TCRs selected to express in hybridomas. (G) IL-2 response of T cell hybridomas to medium and BeSO4 presented by splenic B cells isolated from HLA-DP2 transgenic mice. Data are representative of 3 experiments done in triplicate.

