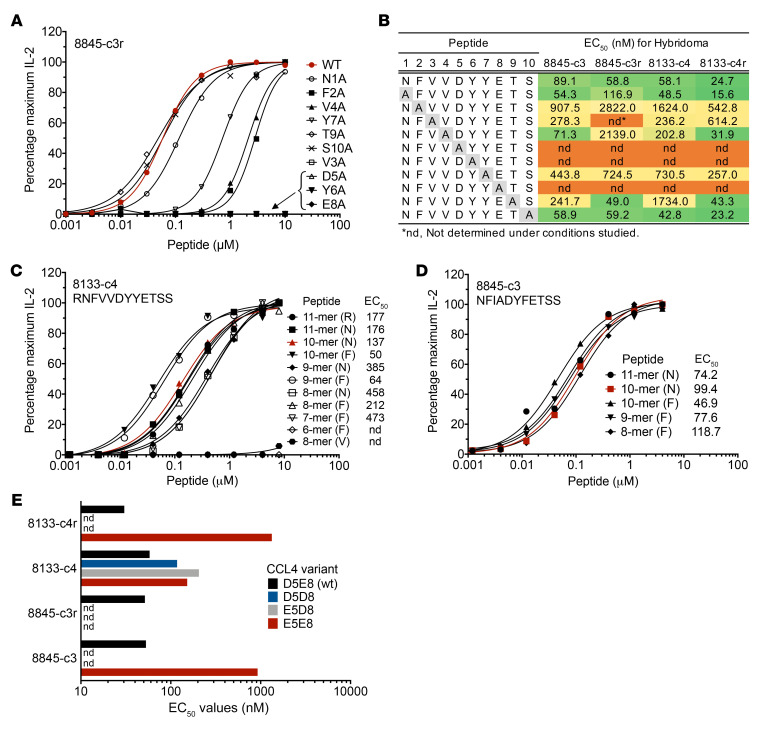
Figure 4. Characterization of human chemokine-derived peptides that stimulate Be-specific T cell hybridomas expressing the LKGGG CDR3β CBD public motif.
(A) Dose-response curves to CCL4 peptides with single alanine substitutions are shown for representative hybridoma 8845-c3r. Data are plotted as the percentage of maximum IL-2 secretion against peptide concentration in the presence of BeSO4. The natural CCL4 peptide (WT) curve is drawn in red. (B) Summary of CCL4 peptide alanine scan for 4 T cell hybridomas. EC50 values (nM) are presented for a representative experiment and are color coded based on peptide activity (green, high; yellow, moderate; orange, negative). (C and D) Dose-response curves of representative hybridomas 8133-c4 (C) and 8845-c3 (D) in response to length variants of the CCL4 (C) and CCL3 (D) peptides are shown. Length and first amino acid (single-letter code) of each peptide is indicated, and EC50 values (nM) of each experiment are displayed. (E) EC50 values (nM) quantitating T cell hybridoma (n = 4) responses to CCL4 peptides with varying acidic amino acid composition (aspartic acid or glutamic acid) at positions p5 and p8 are shown. Data are representative of 2 separate experiments. nd, not determined due to low responses.

