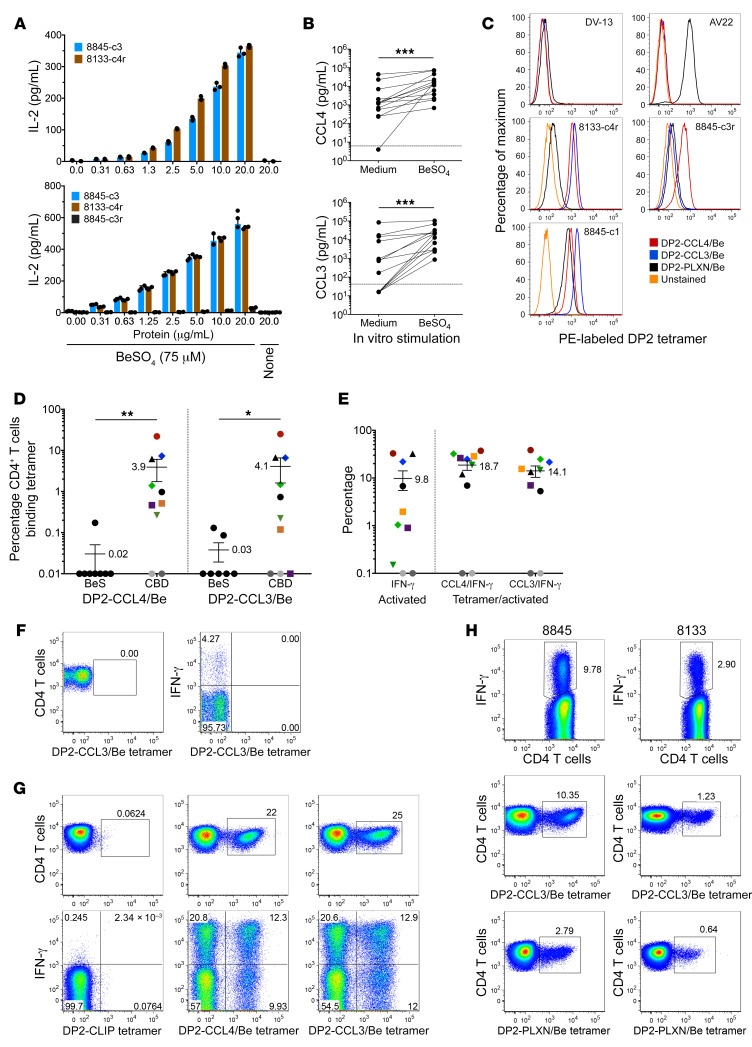
Figure 6. Validation of Be-modified CCL4 and CCL3 as antigenic targets of CD4+ T cells in CBD.
(A) IL-2 response (mean ± SD pg/ml) of LKGGG CDR3β hybridomas to recombinant CCL4 (upper) and CCL3 (lower) proteins is displayed. Results are representative of 2 experiments. (B) In vitro Be-induced secretion of CCL4 (upper) and CCL3 (lower) from BAL cells isolated from CBD patients (n = 13) is shown. Chemokines were assessed by ELISA in duplicate. Dotted lines represent ELISA limits of detection. Statistical significance was determined using Wilcoxon’s rank sum test. ***P < 0.001. (C) Staining of T cell hybridomas with BeSO4-saturated HLA-DP2 tetramers. (D) Summary of HLA-DP2 tetramer staining of ex vivo BAL cells from BeS (n = 7–8) and CBD (n = 10) subjects. For HLA-DP2+ CBD patients, each subject is represented by a different color/symbol combination. Statistical significance was determined using a Mann-Whitney U test. *P < 0.05; **P < 0.01. (E) Summary of HLA-DP2 tetramer and IFN-γ ICS of ex vivo BAL cells from HLA-DP2+ CBD patients. Color/symbol combinations used for patients match those in D. Percentages (mean ± SEM) of CD4+ T cells expressing IFN-γ and the fraction of CD4+ T cells expressing IFN-γ that also bind each tetramer are shown. Gray circles represent patients with no evidence of active disease. (F) Flow cytometric analysis of HLA-DP2 tetramer and intracellular IFN-γ staining of ex vivo BAL cells from an HLA-DP2– CBD patient is displayed. (G) Flow cytometric density plots showing the frequency of CD4+ T cells from CBD patient 8845 that bind to HLA-DP2–CLIP (upper left), HLA-DP2–CCL4/Be (upper middle), and HLA-DP2–CCL3/Be tetramers. Density plots in lower panels depict tetramer staining in relation to IFN-γ expression induced in CD4+ T cells after stimulation with BeSO4 (lower left, medium control). (H) Tetramer/ICS staining of ex vivo BAL cells from CBD patients 8845 (left) and 8133 (right) 5 years after single-cell TCR studies and flow cytometric analysis of BAL cells. Cells were stained for intracellular IFN-γ (upper panels), HLA-DP2–CCL3/Be (middle panels), and HLA-DP2–PLXN/Be tetramers (lower panels).

