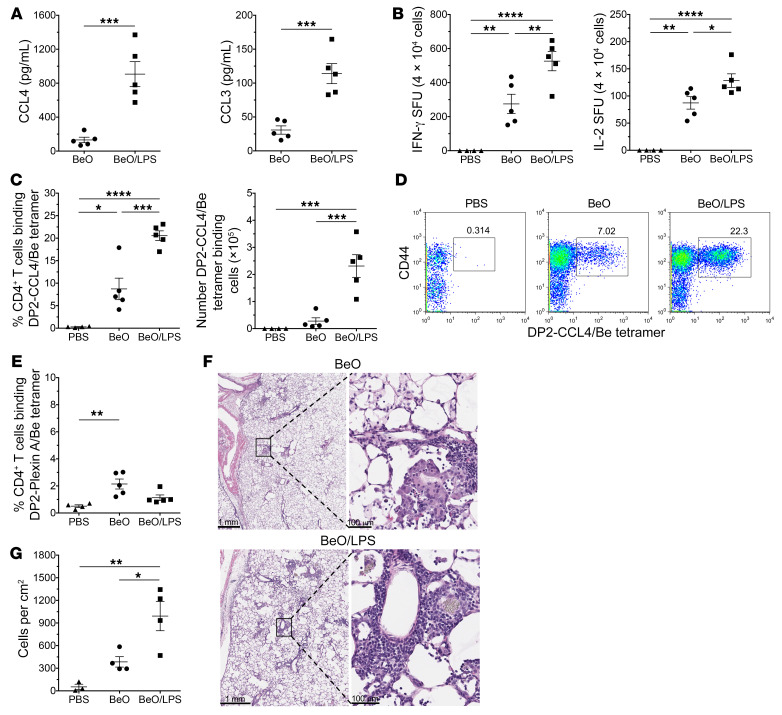
Figure 8. LPS increased chemokine/Be-specific CD4+ T cells and inflammation in BeO-exposed HLA-DP2 Tg mice.
(A) CCL4 (left) and CCL3 (right) measured by ELISA (pg/ml) in the BAL fluid of FVB/N HLA-DP2 Tg mice. After standard sensitization with BeO, mice were boosted on day 14 with either BeO (n = 5) or BeO plus LPS (10 μg; n = 5) and sacrificed 24 hours later. (B) Frequency of Be-specific CD4+ T cells at day 21 in the lungs of PBS- (n = 4), BeO- (n = 5), and BeO/LPS-treated (n = 5) HLA-DP2 Tg mice measured by IFN-γ (left) and IL-2 (right) ELISPOT is shown. Data are expressed as the mean ± SEM spot-forming units per 4 × 10⁴ cells. (C) Shown are the frequency (left) and total number (right) of HLA-DP2–CCL4/Be tetramer staining CD4+ T cells isolated from the lungs of PBS- (n = 4), BeO (n = 5), and BeO/LPS-treated mice (n = 5) sacrificed on day 21. (D) Flow cytometric density plots illustrating representative HLA-DP2–CCL4/Be tetramer staining of lung cells derived from PBS- (left), BeO- (middle), and BeO/LPS-exposed (right) HLA-DP2 Tg mice sacrificed on day 21. (E) Frequency of HLA-DP2–plexin A/Be tetramer staining CD4+ T cells from the lungs of mice treated as indicated (PBS, n = 4; BeO, n = 5; BeO/LPS, n = 5). (F) Representative H&E staining of lungs from BeO-treated (upper panels) and BeO/LPS-treated (lower panels) mice showing mononuclear cell infiltrates at low and higher magnification. (G) Quantification of mononuclear cells in lung tissue of HLA-DP2 Tg mice treated as indicated (PBS, n = 3; BeO n = 4; BeO/LPS, n = 4). Bars for all data plots represent the mean ± SEM. *P < 0.05; **P < 0.01; ***P < 0.001; ****P < 0.0001, Mann-Whitney U test (A) and 1-way ANOVA (B, C, E, and G). Data are representative of 2 separate experiments.

