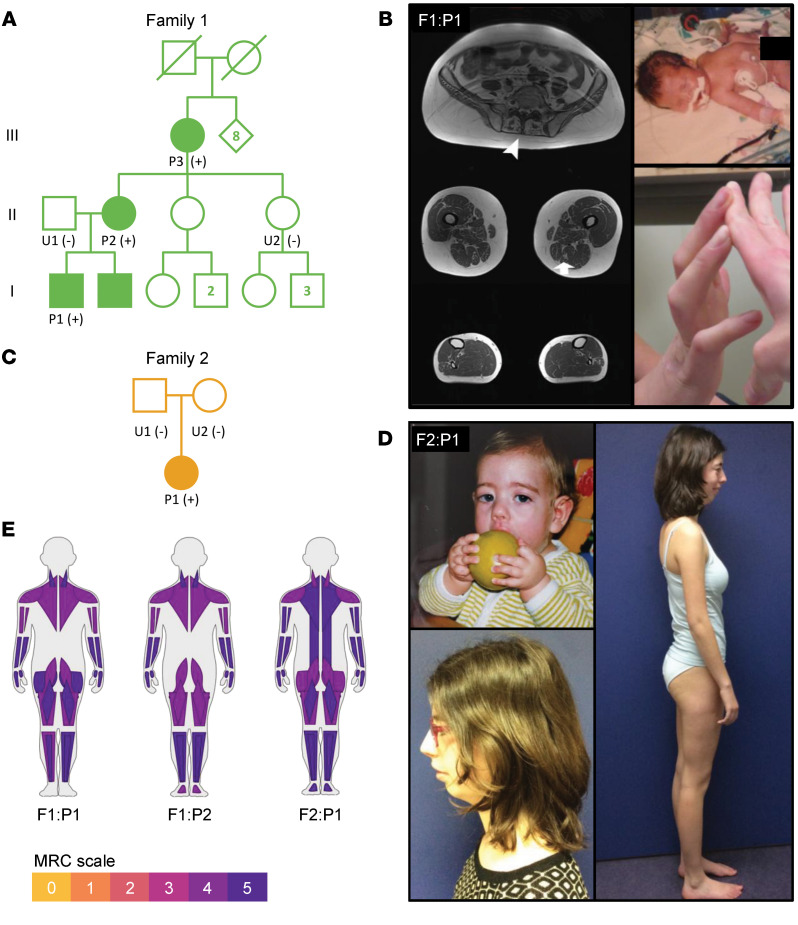
Figure 2. Pedigrees and clinical description of F1:P1 and F2:P1.
(A) Pedigree of family 1 showing multiple affected relatives in different generations, consistent with autosomal dominant inheritance. The + and – symbols in parentheses indicate positive and negative for the TNNC2 c.100G>T; p.D34Y missense variant by Sanger sequencing. Circles indicate female, squares indicate male, clinically affected relatives are shaded green, and unaffected relatives are unfilled white. (B) Left: Muscle MRI imaging of F1:P1. T1-axial images of the lower extremities show mild, focal fatty infiltration of different muscles in a patchy and heterogeneous pattern (arrows). Paraspinal muscles are significantly affected in F1:P1 (top left, arrowheads). Proximal thigh muscles (middle left) are more affected than lower leg muscles (bottom left). Right: Photograph of F1:P1 at age 6 weeks with hypotonia and lower-extremity weakness (top right) and at age 26 years with contractures of the long finger flexors (bottom right). (C) Pedigree of family 2. (D) Photograph of F2:P1 as an infant indicating weakness in the facial muscles (top left) and at age 19 years with normal muscle mass and retrognathia. (E) Visualization of muscle weakness using MuscleViz (https://muscleviz.github.io), based on the MRC scores (59).

