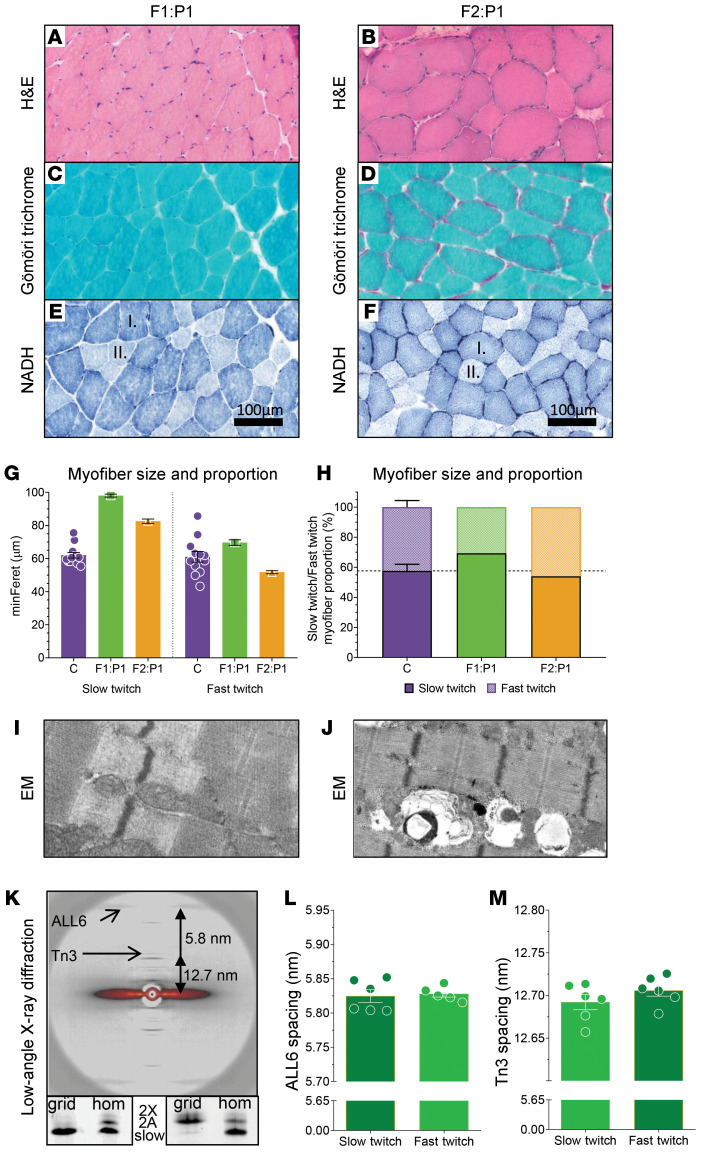
Figure 3. Histology of F1:P1 spinal accessory muscle biopsy at age 16 years (left) and F2:P1 vastus lateralis muscle biopsy at age 9 years (right).
(A and B) H&E staining shows mild myofiber size variability in both patients. (C and D) Gömöri trichrome staining shows no signs of nemaline rods in myofibers of both patients. (E and F) Staining of NADH in muscle cross sections shows larger slow-twitch fibers (dark blue, indicated with “I.”) than fast-twitch fibers (light blue, indicated with “II.”) in both patients. (G) Graph showing the myofiber minFeret of slow-twitch versus fast-twitch myofibers in control subjects (C), F1:P1, and F2:P1. (H) Graph showing the proportion of slow-twitch versus fast-twitch myofibers in control subjects (C), F1:P1, and F2:P1. The dark shading indicates the proportion of slow-twitch fibers and the light shading indicates the proportion of fast-twitch fibers. (I and J) Electron microscopy images show no abnormalities, and an intact myofibrillar structure in both patients. (K) Top: Typical example of a low-angle x-ray diffraction pattern obtained from 28 fast-twitch myofibers of F1:P1 mounted and aligned in 1 plane between 2 halves of an electron microscopy grid. Note the well-resolved equatorial and meridional reflections. Arrows indicate the actin layer line 6 (ALL6) and Tn3 reflections. Bottom: Myosin heavy chain isoform composition of the myofibers in the grids, showing successful segregation of fast- and slow-twitch fibers from F1:P1 (grid = protein content of F1:P1 grids; hom = muscle homogenate from human diaphragm muscle; 2X and 2A = fast-twitch myosin heavy chain isoforms; slow = slow-twitch myosin heavy chain isoform). Spacing of the ALL6 reflection (L) and the Tn3 reflection (M) are comparable between slow- and fast-twitch myofibers. Each symbol represents data from 1 set of grids containing 28 myofibers. Data are depicted as mean ± SEM.

