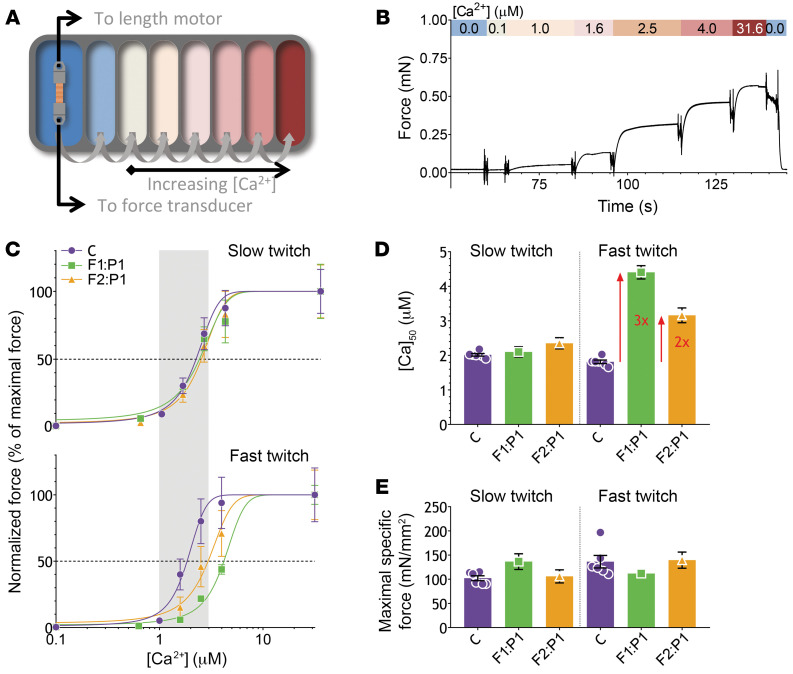
Figure 5. The experimental design and results of the myofiber contractility experiments.
(A) Schematic representation of the contractility setup. An isolated single myofiber between aluminum T-clips is mounted between a force transducer and length motor. The fiber is subsequently passed through the baths filled with solutions with increasing [Ca2+]. (B) Typical tracing showing the force response to the increasing [Ca2+], followed by the protocol in which a rapid release and restretch (kTR) and short-length perturbations (active stiffness) were imposed on the myofibers ([Ca2+], kTR, and active stiffness are indicated in the colored bar). Data shown are from a control myofiber (fast twitch, CSA = 0.0054 mm2). (C) The force-[Ca2+] relationship, showing the average of all slow-twitch (top) and fast-twitch (bottom) control myofibers (C) versus the slow-twitch and fast-twitch myofibers from F1:P1 and F2:P1. The physiological [Ca2+] range is indicated by the gray bar. (D) The [Ca2+] at which 50% of maximal force is reached. (E) The maximal force normalized to myofiber CSA (i.e., specific force). Data are depicted as mean ± SEM.

