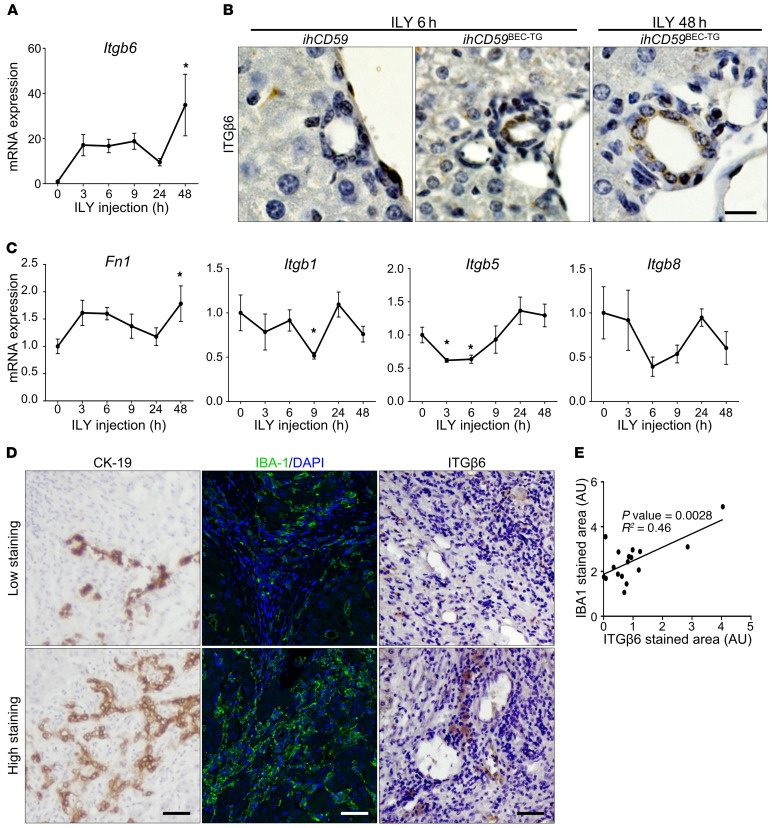
Figure 4. Increased ITGβ6 levels correlate with the ductular reaction in the ILY-ihCD59BEC-TG model and in human chronic liver diseases.
(A–C) ihCD59 and ihCD59BEC-TG mice were injected intravenously with ILY. (A) qRT-PCR analysis of relative expression of the Itgb6 gene in liver homogenates (n = 3–7 per group). (B) ITGβ6 immunostaining of BECs from ILY-treated ihCD59BEC-TG mice. Scale bar: 12.5 μm. (C) qRT-PCR analysis of relative gene expression of Fn1, Itgb1, Itgb5, and Itgb8 in liver homogenates (n = 3–7 per group). Data represent the mean ± SEM. *P < 0.05 compared with control ihCD59 mice, by 1-way ANOVA. (D) Representative immunostaining images from 17 livers of patients with cholangiopathies (PBC and PSC), showing a correlation between CK19, IBA1, and ITGβ6 staining. Scale bars: 50 μm. (E)ITGβ6 and IBA1 staining was quantified, and a correlation was established using Pearson’s r.

