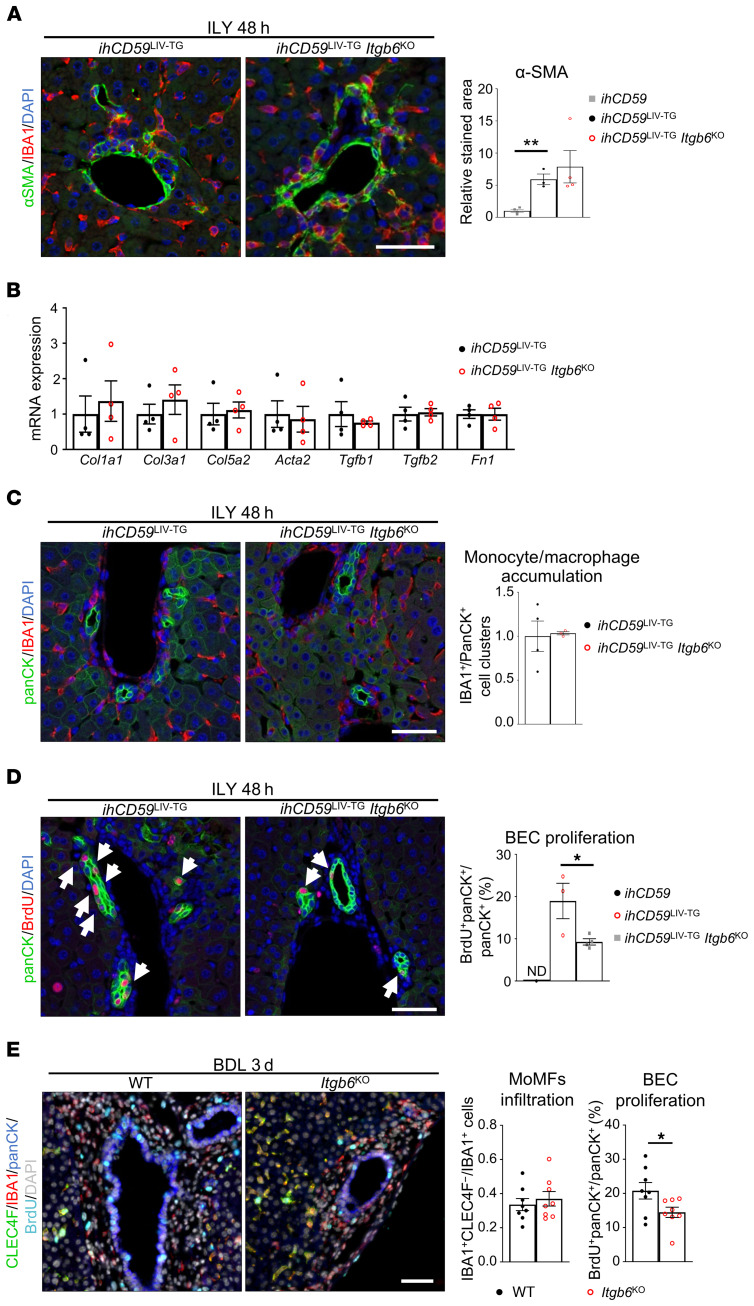
Figure 5. ITGβ6 deficiency impairs BEC proliferation but not early portal fibrosis or inflammation in 2 models of bile duct injury.
(A–D) ihCD59LIV-TG and ihCD59LIV-TG Itgb6KO mice were injected intravenously with ILY, and samples were collected at the indicated time points after ILY injection. (A) IBA1 (red) and α-SMA (green) staining and quantitation were performed (n = 3–4 per group). (B) Liver mRNA expression of fibrogenesis-related genes was assessed by qRT-PCR (n = 4 per group). (C) panCK (green) and IBA1 (red) staining was performed, and cell clusters were quantified (n = 3–4 per group). (D) panCK (green) and BrdU (red) staining and quantitation were performed (n = 3–4 per group). White arrows indicate BrdU+ BECs. (E) WT and Itgb6KO mice were euthanized 3 days after BDL. Immunostaining was performed on FFPE liver sections (single-channel images are shown in Supplemental Figure 7), and then monocyte-derived IBA1+CLEC4F– macrophages and proliferating BrdU+panCK+ BECs were quantified (n = 8 per group). Data represent the mean ± SEM. *P < 0.05 and **P < 0.01, by unpaired Student’s t test (A, C, and E) and 1-way ANOVA (B and D). Scale bars: 50 μm.

