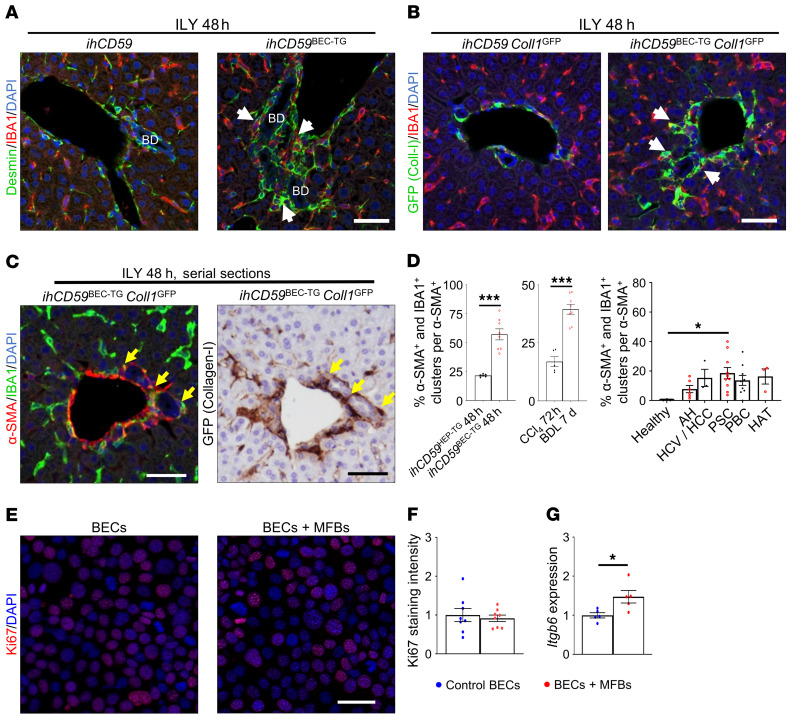
Figure 6. Myofibroblast activation is closely related to macrophage accumulation and BEC proliferation and increases Itgb6 expression after acute BEC injury.
(A) ihCD59 and ihCD59BEC-TG mice were injected with ILY, and desmin (green) and IBA1 (red) staining was performed on liver sections. White arrows show close localization of IBA1+ and desmin+ cells. Scale bar: 50 μm. BD, bile duct. (B) ihCD59Coll1GFP and ihCD59BEC-TG Coll1GFP mice were injected with ILY, and GFP (green) and IBA1 (red) staining was performed. White arrows indicate stained cell clusters. Scale bar: 50 μm. (C) α-SMA (red) and IBA1 (green) or collagen GFP (brown) immunostaining on serial liver sections. Arrows indicate cell clusters. Scale bars: 50 μm. (D) α-SMA and IBA1 staining was performed, and stained cell clusters were quantitated in the indicated models of liver injury or in liver sections from patients with chronic liver disease (n = 3–10 per group). ILY-treated ihCD59Hep-TG and ILY-treated ihCD59BEC-TG mice represent hepatocyte and BEC injury models, respectively. Data represent the mean ± SEM. AH, alcoholic hepatitis; HCV/HCC, HCV infection and hepatocellular carcinoma; HAT, hepatic artery thrombosis. (E) Collagen I–producing (GFP+) CD45– MFBs were sorted from CCl4-injected Coll1GFP mouse livers, placed in Transwells, and cocultured with SV40-transformed murine BECs. Ki67 staining was performed in BECs after 24 hours (representative images are shown). Scale bar: 40 μm. (F) Ki67 staining was quantified (n = 4–8 per group). (G) Itgb6 mRNA expression analysis was performed on BECs cultured with primary myofibroblasts (n = 4–8 per group). Data represent the mean ± SEM. *P < 0.05 and ***P < 0.005, by unpaired Student’s t test (F and G) and 1-way ANOVA (D).

