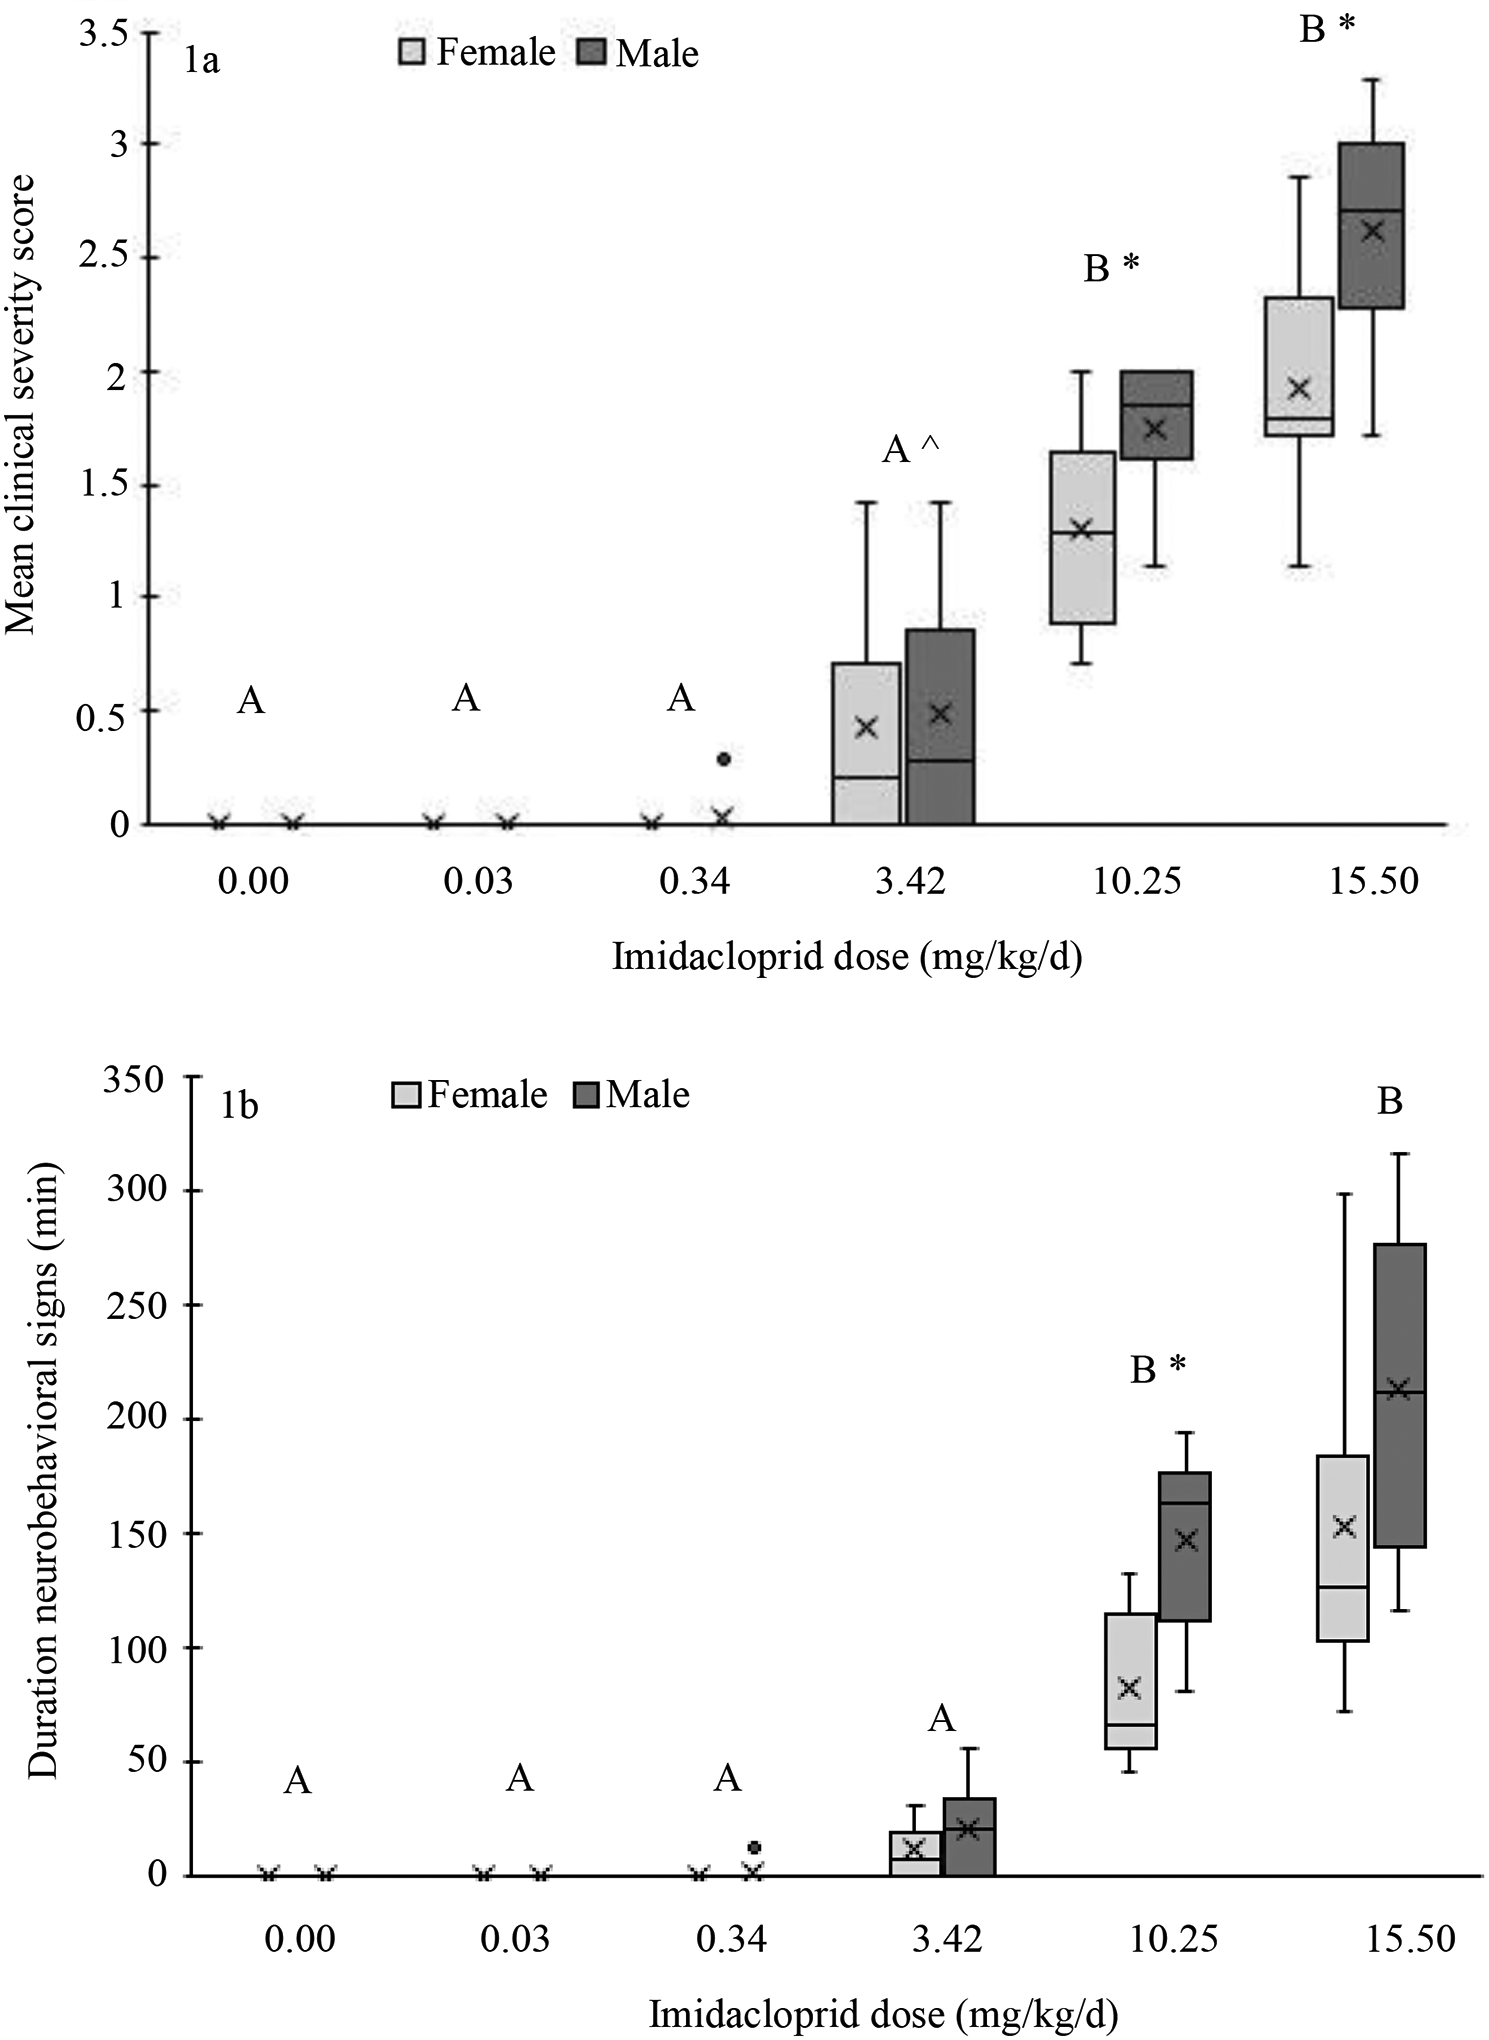
Figure 1:

Box and whisker plot depicting the mean clinical severity score (a) and the mean duration of neurobehavioral signs (b) in domestic chickens after oral imidacloprid exposure by treatment group and sex. The bottom and top of the box represent the first and third quartiles respectively, the horizontal line within the box indicates the median, the “X” within the box indicates the mean, the ends of the whiskers mark one standard deviation above and below the mean, and the circle above the 0.34 mg/kg group represents the single outlier. $$PARABREAKHERE$$Alphabetical letters above the treatment groups indicate statistically significant differences between treatment groups (sexes combined), where groups with different letters are statistically different from each other.
* Indicates statistically significant differences between sexes within the same treatment group
^ Indicates marginally higher mean clinical severity score compared to 0 mg/kg
