Fig. 4.

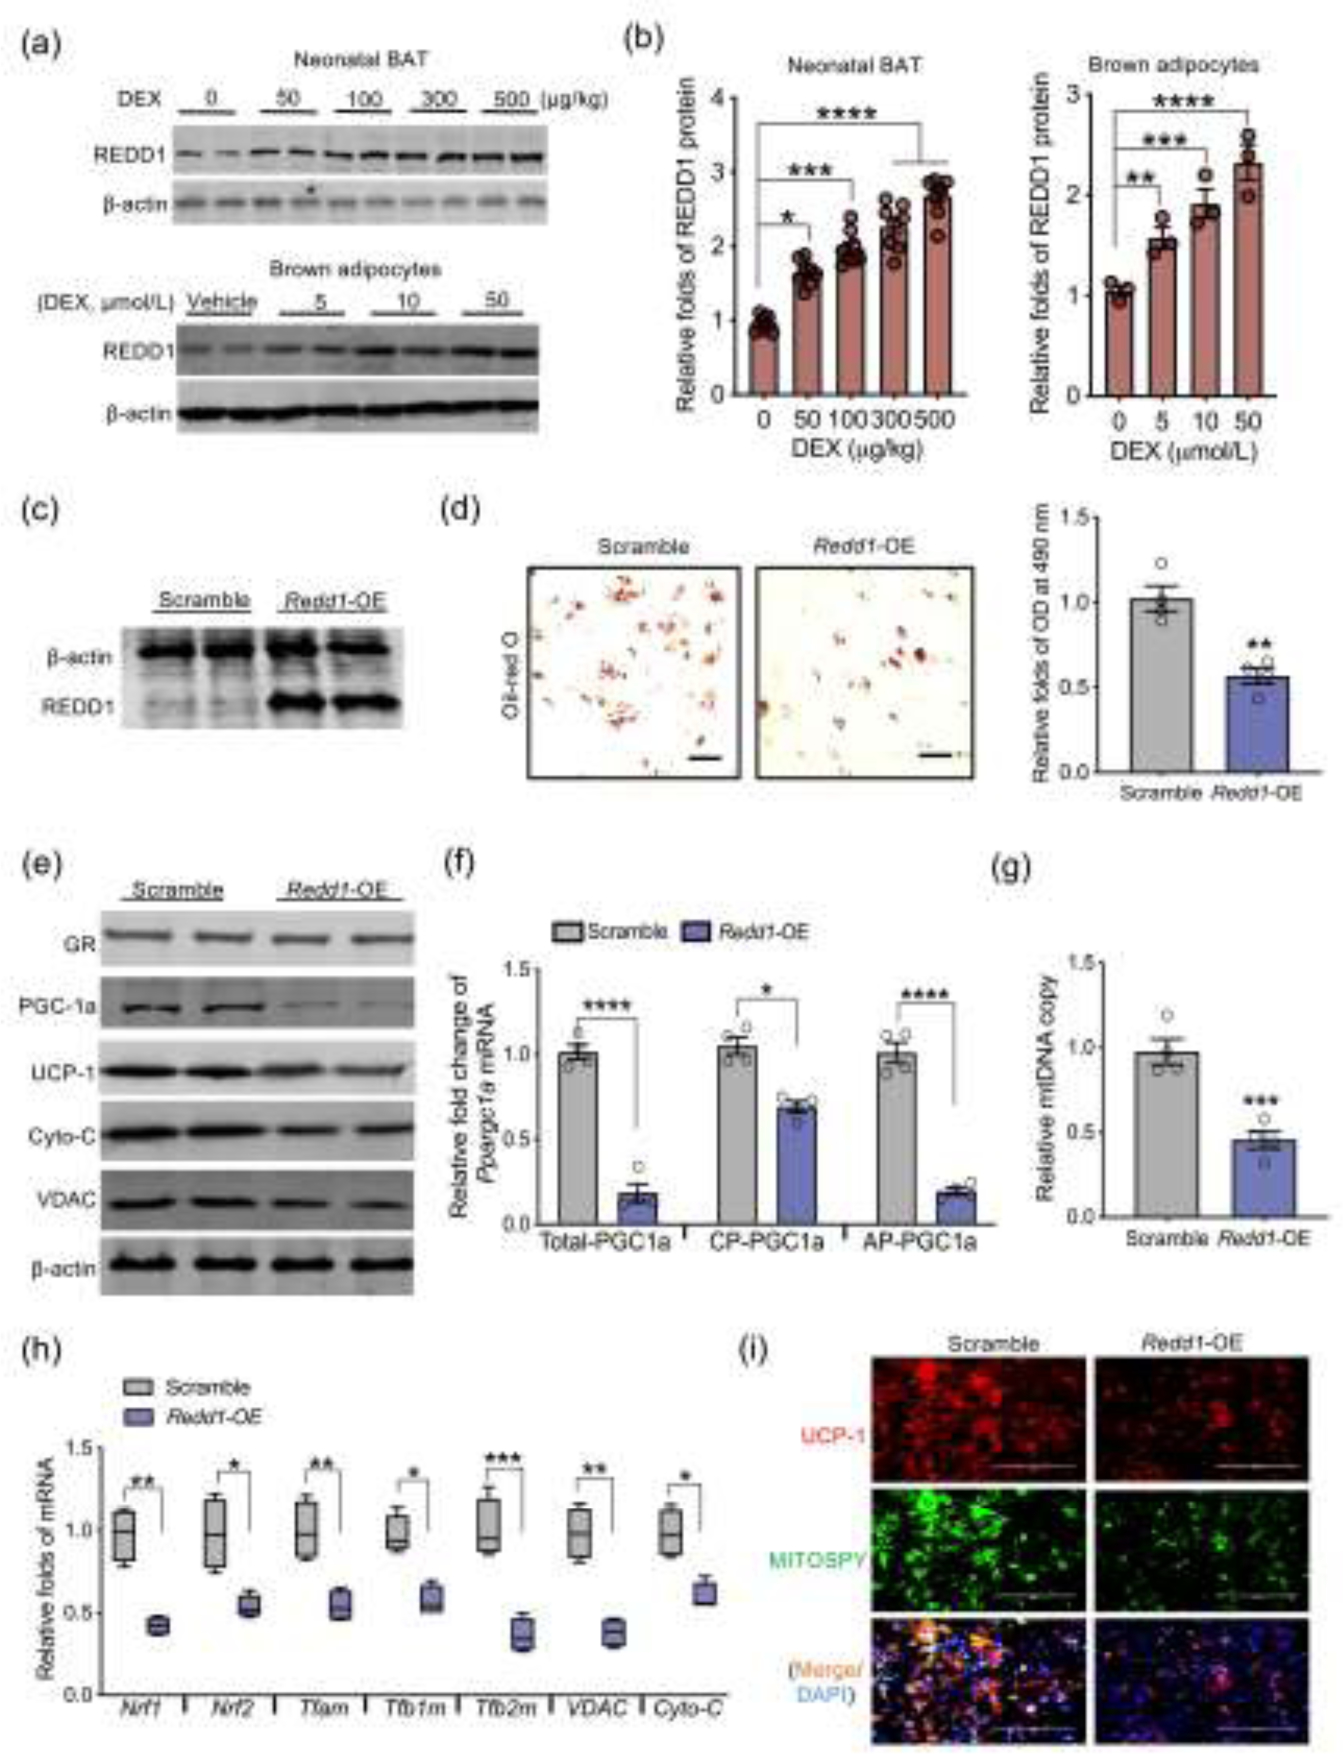
REDD1 activation inhibits brown adipogenesis and Ppargc1a transcription from the alternative promoter. (a and b) Immunoblotting measurement of REDD1 protein content in BAT of neonates born to dexamethasone (DEX) treated mothers during the last trimester of pregnancy (n = 8). REDD1 protein shown in the bottom of Western blot figure was measured from brown adipocytes differentiated from mouse embryonic fibroblasts (MEFs) treated with dosed DEX (n = 4). β-actin was used as a loading control. (c–i) MEFs were transfected with scrambled or open reading frame of Redd1 plasmids for over-expression (Redd1-OE) following brown adipocyte differentiation (n = 4). (c) Immunoblotting measurement of REDD1 in MEFs transfected with Redd1-OE. β-actin was used as a loading control. (d) After brown adipocyte differentiation, lipid droplets were stained by Oil-Red O and quantified at 490 nm (n = 4). Scale bar: 50 μm. (e) Immunoblotting measurements of thermogenic and mitochondrial biomass proteins in differentiated brown adipocytes. β-actin was used as a loading control (n = 4). (f) Ppargc1a transcription from the canonical promoter (CP) and alternative promoter (AP) in differentiated brown adipocytes transfected scrambled or Redd1-OE plasmid. Gene expression was normalized to 18S rRNA (n = 4). (g) Mitochondrial DNA (mtDNA) content in differentiated brown adipocytes. Mitochondrial gene expression was normalized to 18S rRNA and GAPDH (n = 4). (h) mRNA expression of mitochondrial biogenic genes. Gene expression was normalized to 18S rRNA (n = 4). (i) Immunostaining of UCP-1 (red color), mitochondria (MITOSPY, green color) and nucleus (DAPI, blue color) in differentiated brown adipocytes (n = 4). Scale bar: 50 μm. Data are representative of three separate experiments. Data are mean ± SEM and each dot represents one replicate; *P < 0.05, **P < 0.01, ***P < 0.001, and ****P < 0.0001; unpaired Student’s t-test with two-tailed distribution was used in two treatment data analyses.
