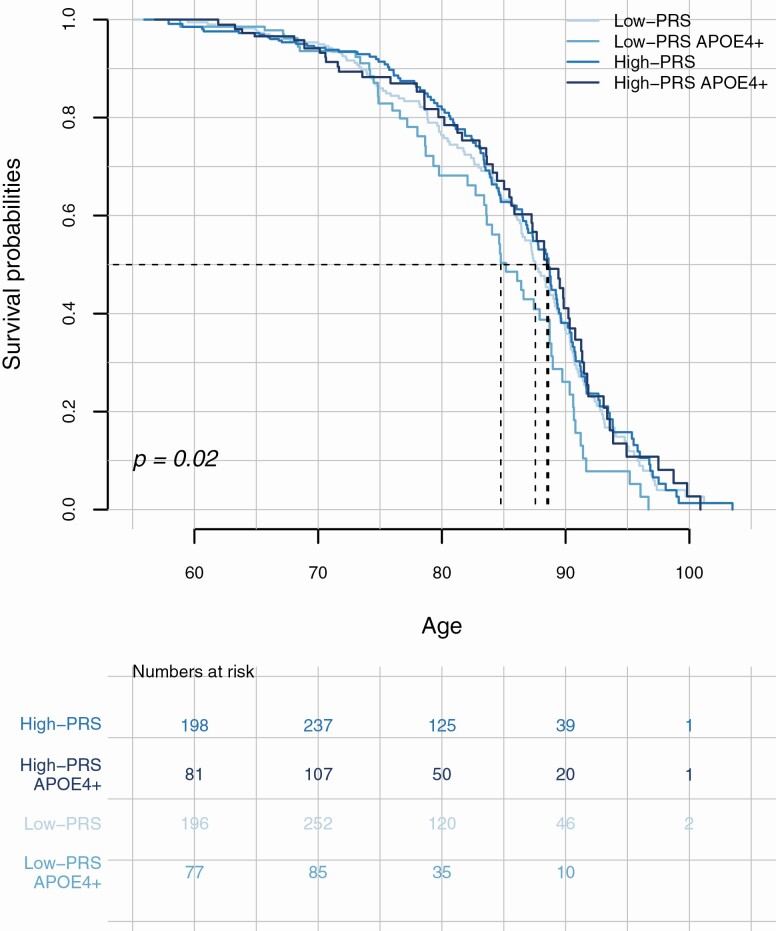
Figure 2.
Association of the PRS-5 model without APOE on survival, stratified by APOE-ε4 status. The top panel shows the survival curves for individuals with high PRS and low PRS, stratified by APOE-ε4 status (dichotomized in “carriers” of APOE-ε4 allele and noncarriers) in the population controls for which follow-up data were available (N = 1620). The p value refers to the association of the PRS-5 in the multivariate Cox regression model while adjusting for gender, APOE-ε4 carriership (dichotomized), and population substructure (PCs 1–5). The lower panel shows the number of samples in each category. PRS = polygenic risk score.

