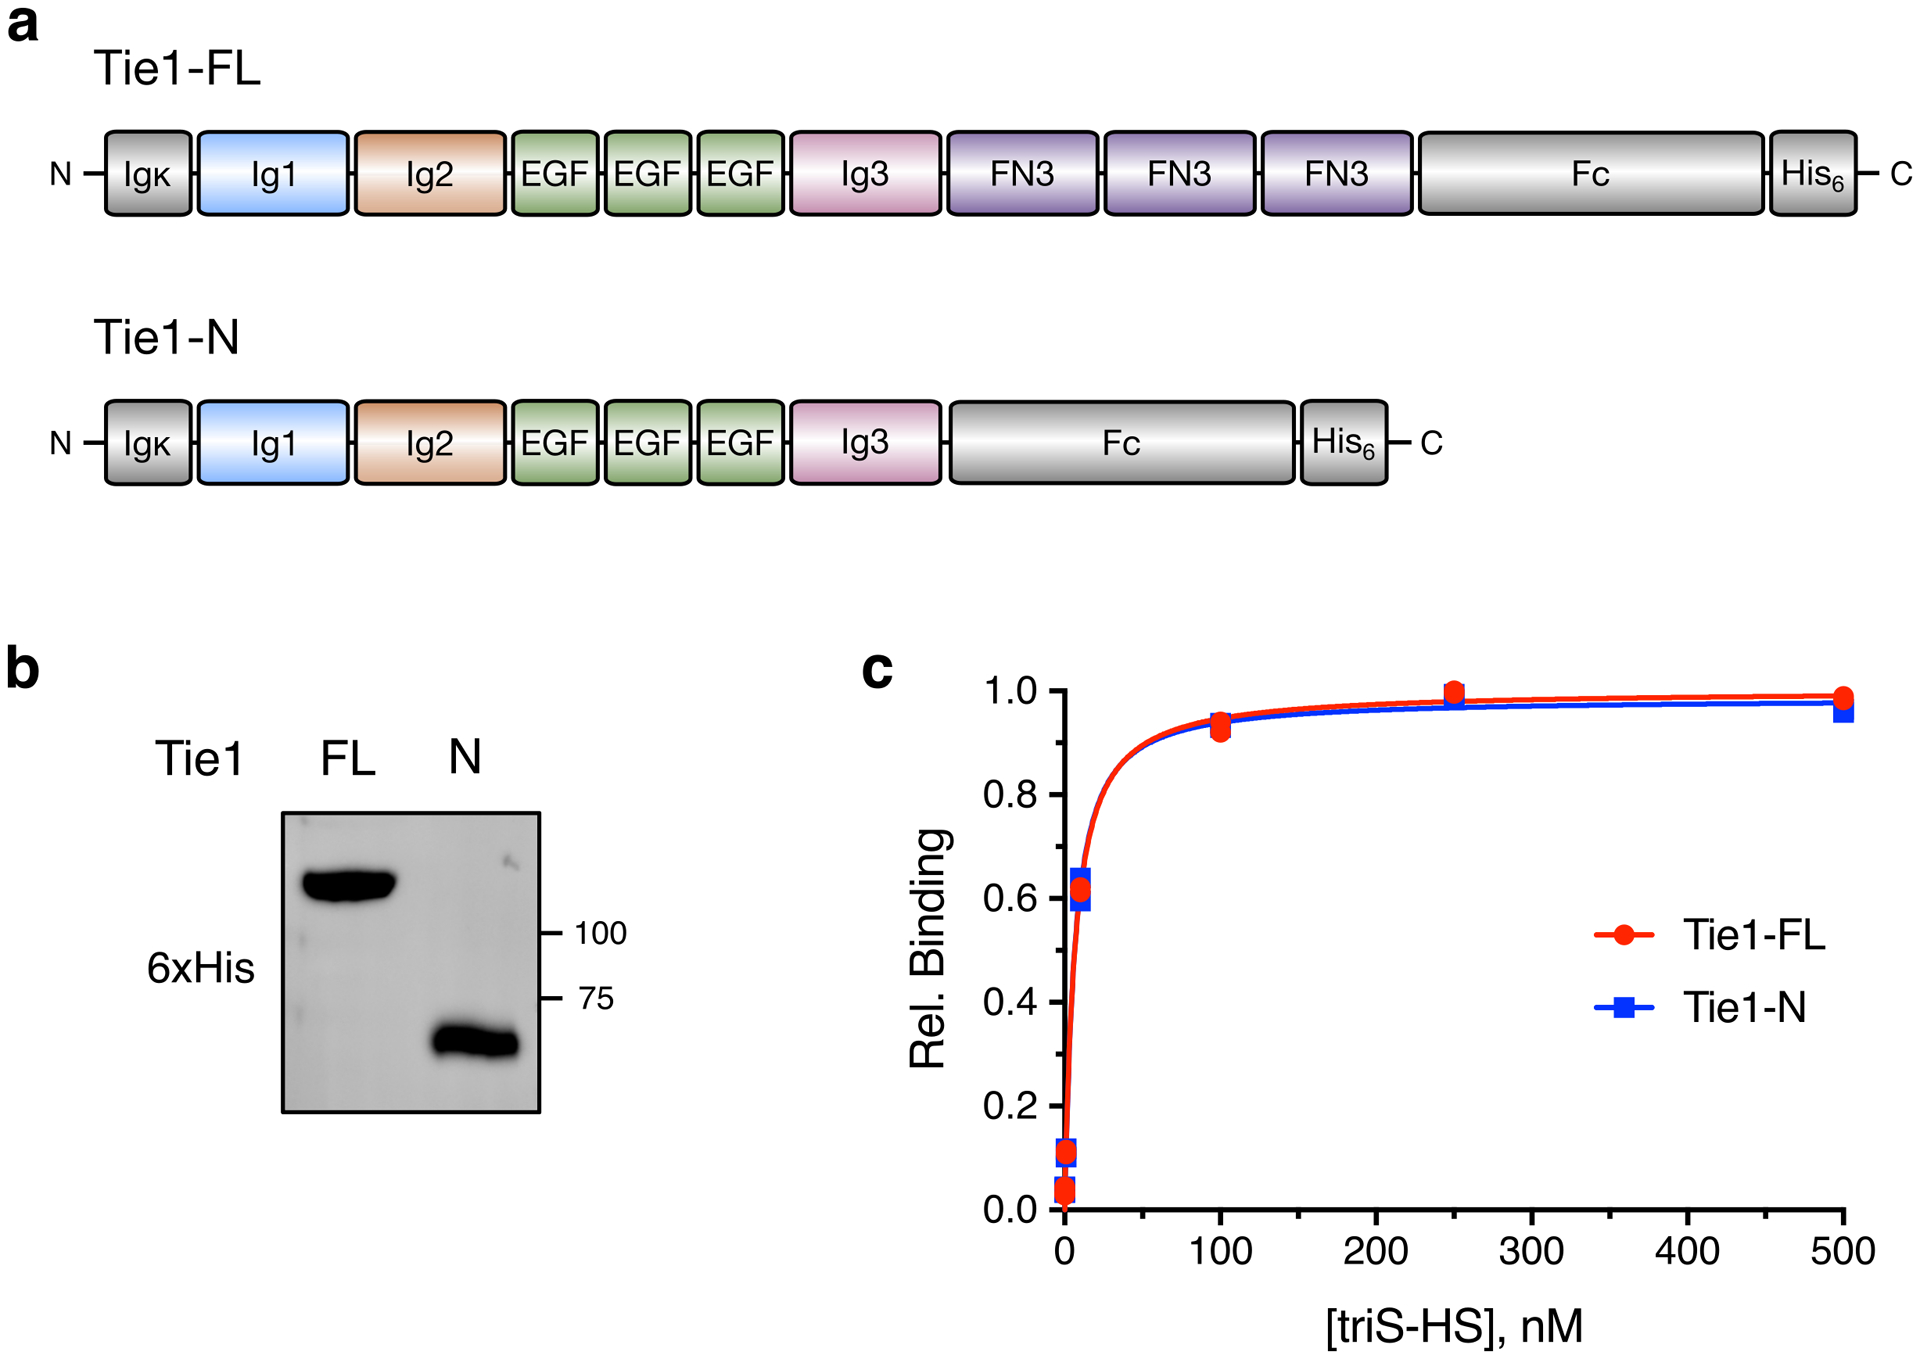
Extended Data Fig. 5. Sulfated HS GAGs engage Tie1 in its N-terminal domains.

(a) Schematic and (b) Western blot of overexpressed, purified full-length (Tie1-FL) and C-terminal truncated (Tie-N) Tie1 ectodomains. Colors in (a) correspond to the ribbon diagram of Tie1 in Fig. 4a. Gray sections are derived from the expression plasmid. (c) Binding of biotinylated triS-HS to recombinant Tie1-FL and Tie-N by ELISA. Data for (c) were obtained in the same experiment as Fig. 4e. Dissociation constants, as determined by ELISA: KD,app (Tie1-FL) = 6.51 nM (5.58 to 7.63 nM), KD,app (Tie1-N) = 6.26 nM (5.26 to 7.45 nM); values represent mean (95% CI); graphed data represent n = 2 independent replicates.
