
Extended Data Fig. 6. HS GAGs engage Tie1 in an electropositive region of the first N-terminal Ig-like domain.
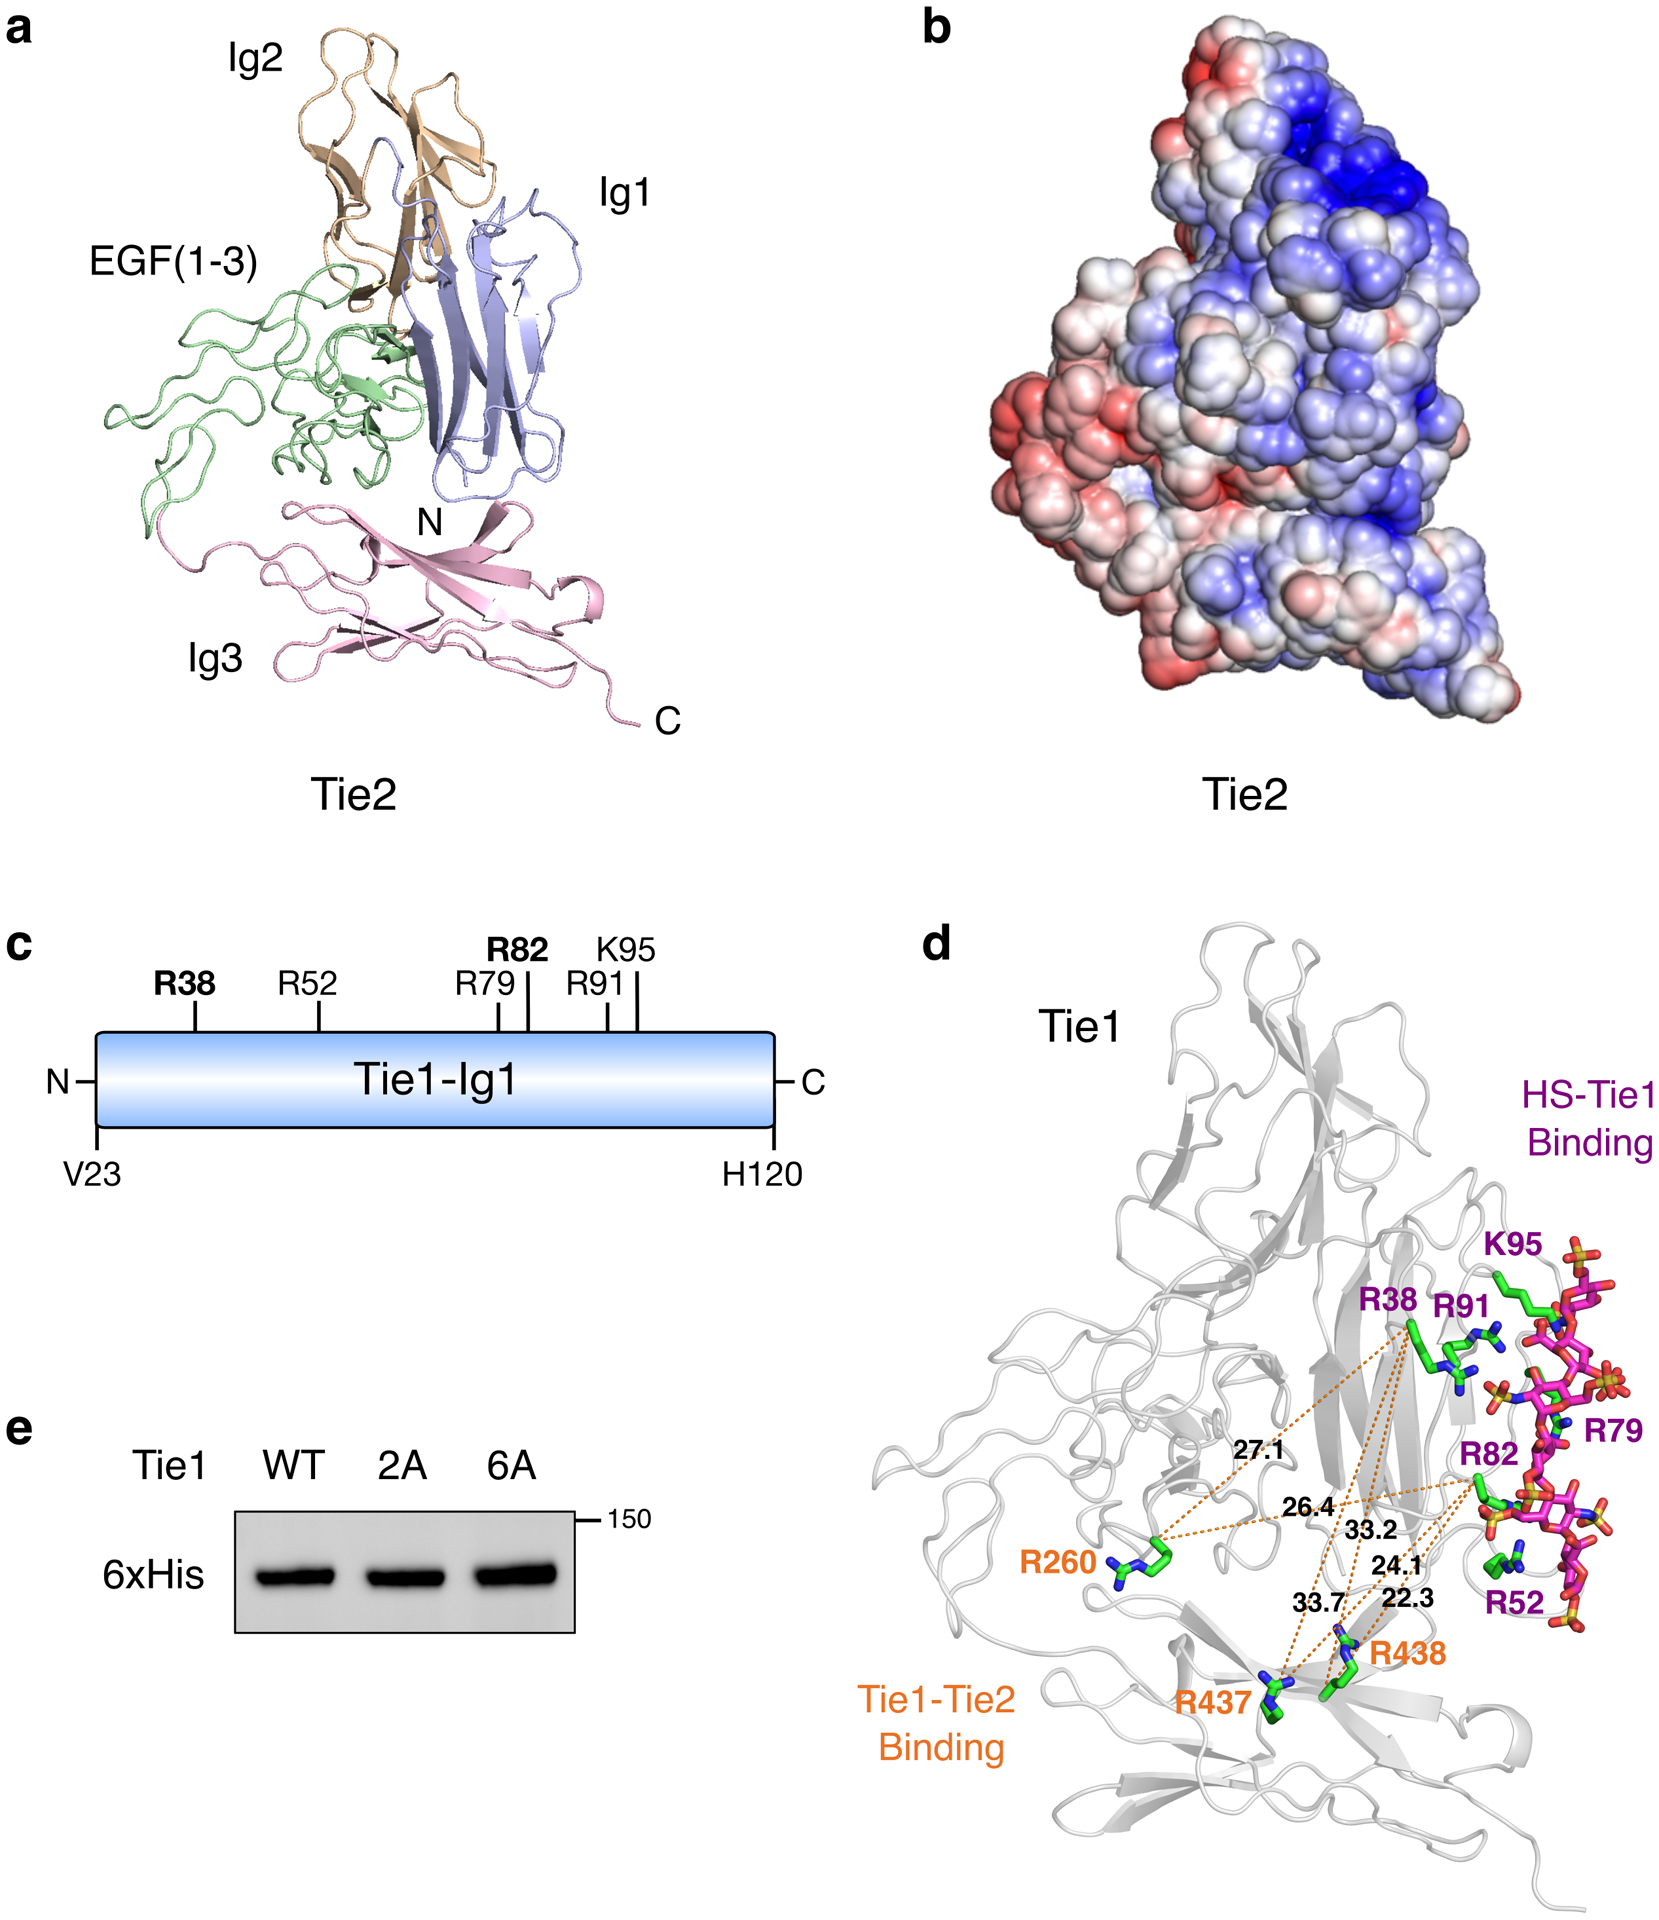
(a) Ribbon diagram and (b) electrostatic potential surface of the Tie2 crystal structure (pdb 2GY5), which lacks the electropositive HS binding site found in Tie1. The red to blue scale in (b) represents relative electrostatic potential (electronegative to electropositive). (c) Schematic of the first N-terminal Ig-like domain (Ig1) of Tie1, highlighting the six positively charged amino acids within 5–10 Å of the top 10 highest ranked HS GAG docked poses. All residues are mutated to alanine in the Tie1-6A construct, whereas only the two bolded residues are mutated in Tie1-2A. (d) Structural model of the Tie1 N-terminal region (residues 22–447) indicating key amino acid residues involved in HS binding (purple) and those reported to be involved in Tie2 binding (orange).27 Distances are displayed in angstroms between the alpha carbon of each residue. (e) Western blot showing expression of secreted Tie1 ectodomain constructs from HEK-293T cells after purification.