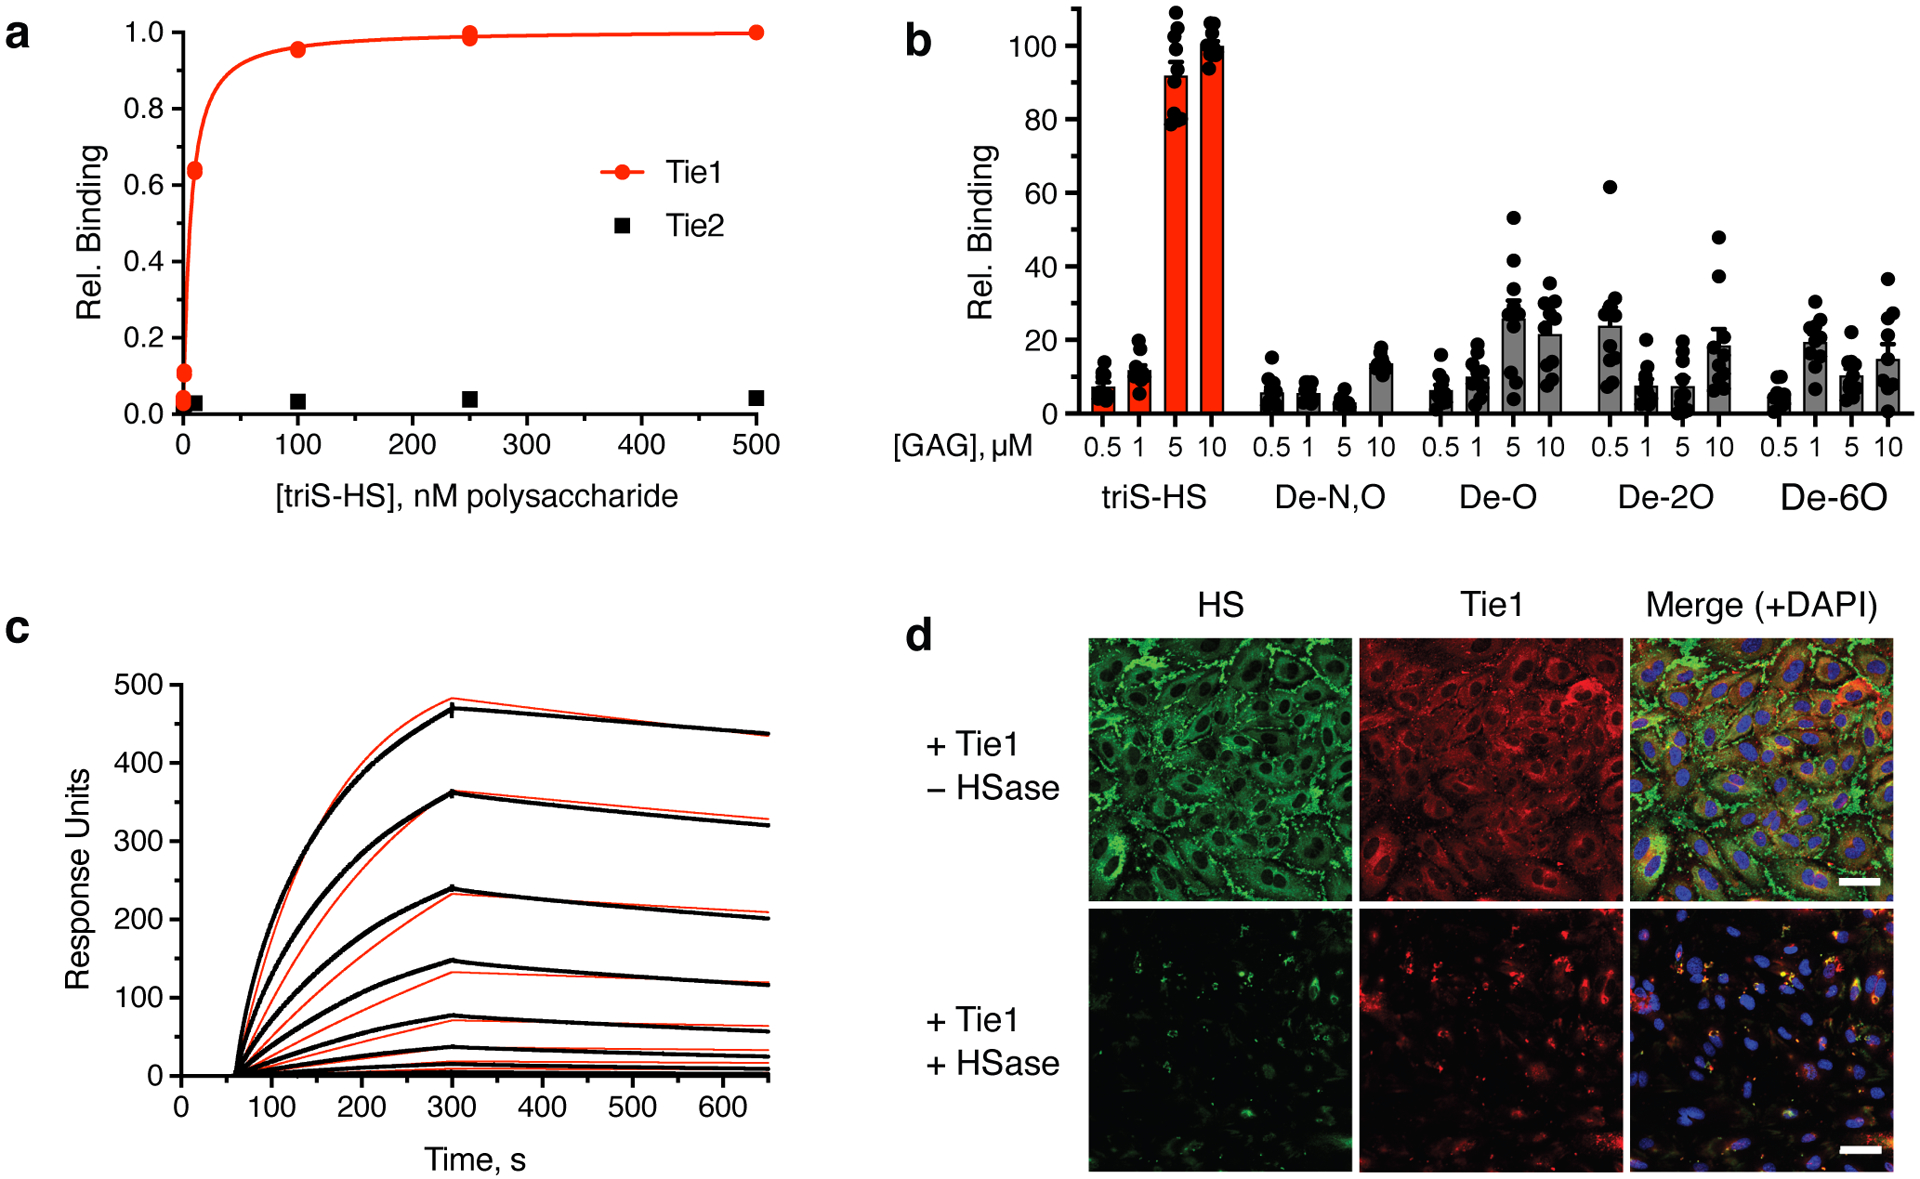
Figure 3. The orphan receptor Tie1 binds to the trisulfated motif of HS.

Binding was demonstrated by (a) ELISA, (b) glycan microarray, and (c) surface plasmon resonance. Dissociation constant for Tie1, as determined by ELISA: KD,app = 6.16 nM (5.40 to 7.01 nM); value represents mean (95% CI); graphed data represent n = 2 independent replicates. This value is similar to dissociation constants reported for other GAG-protein interactions.33,37 For glycan microarrays, data represent mean ± s.e.m., n = 10 individual spots per glycan concentration. Dissociation constant for Tie1, as determined by SPR: KD,app = 3.14 nM (3.12 to 3.15 nM); value represents mean (95% CI). SPR data were fit using a 1:1 Langmuir model shown in red. (d) Immunofluorescence images of HS GAGs (green) and Tie1-Fc ectodomain (red) binding to HUVECs treated with or without heparinase (HSase), scale bar = 50 μm. Nuclear staining by DAPI is shown in blue. Images are representative of 3 biologically independent samples.
