
Figure 4. HS engages Tie1 within its first Ig-like domain (Ig1).
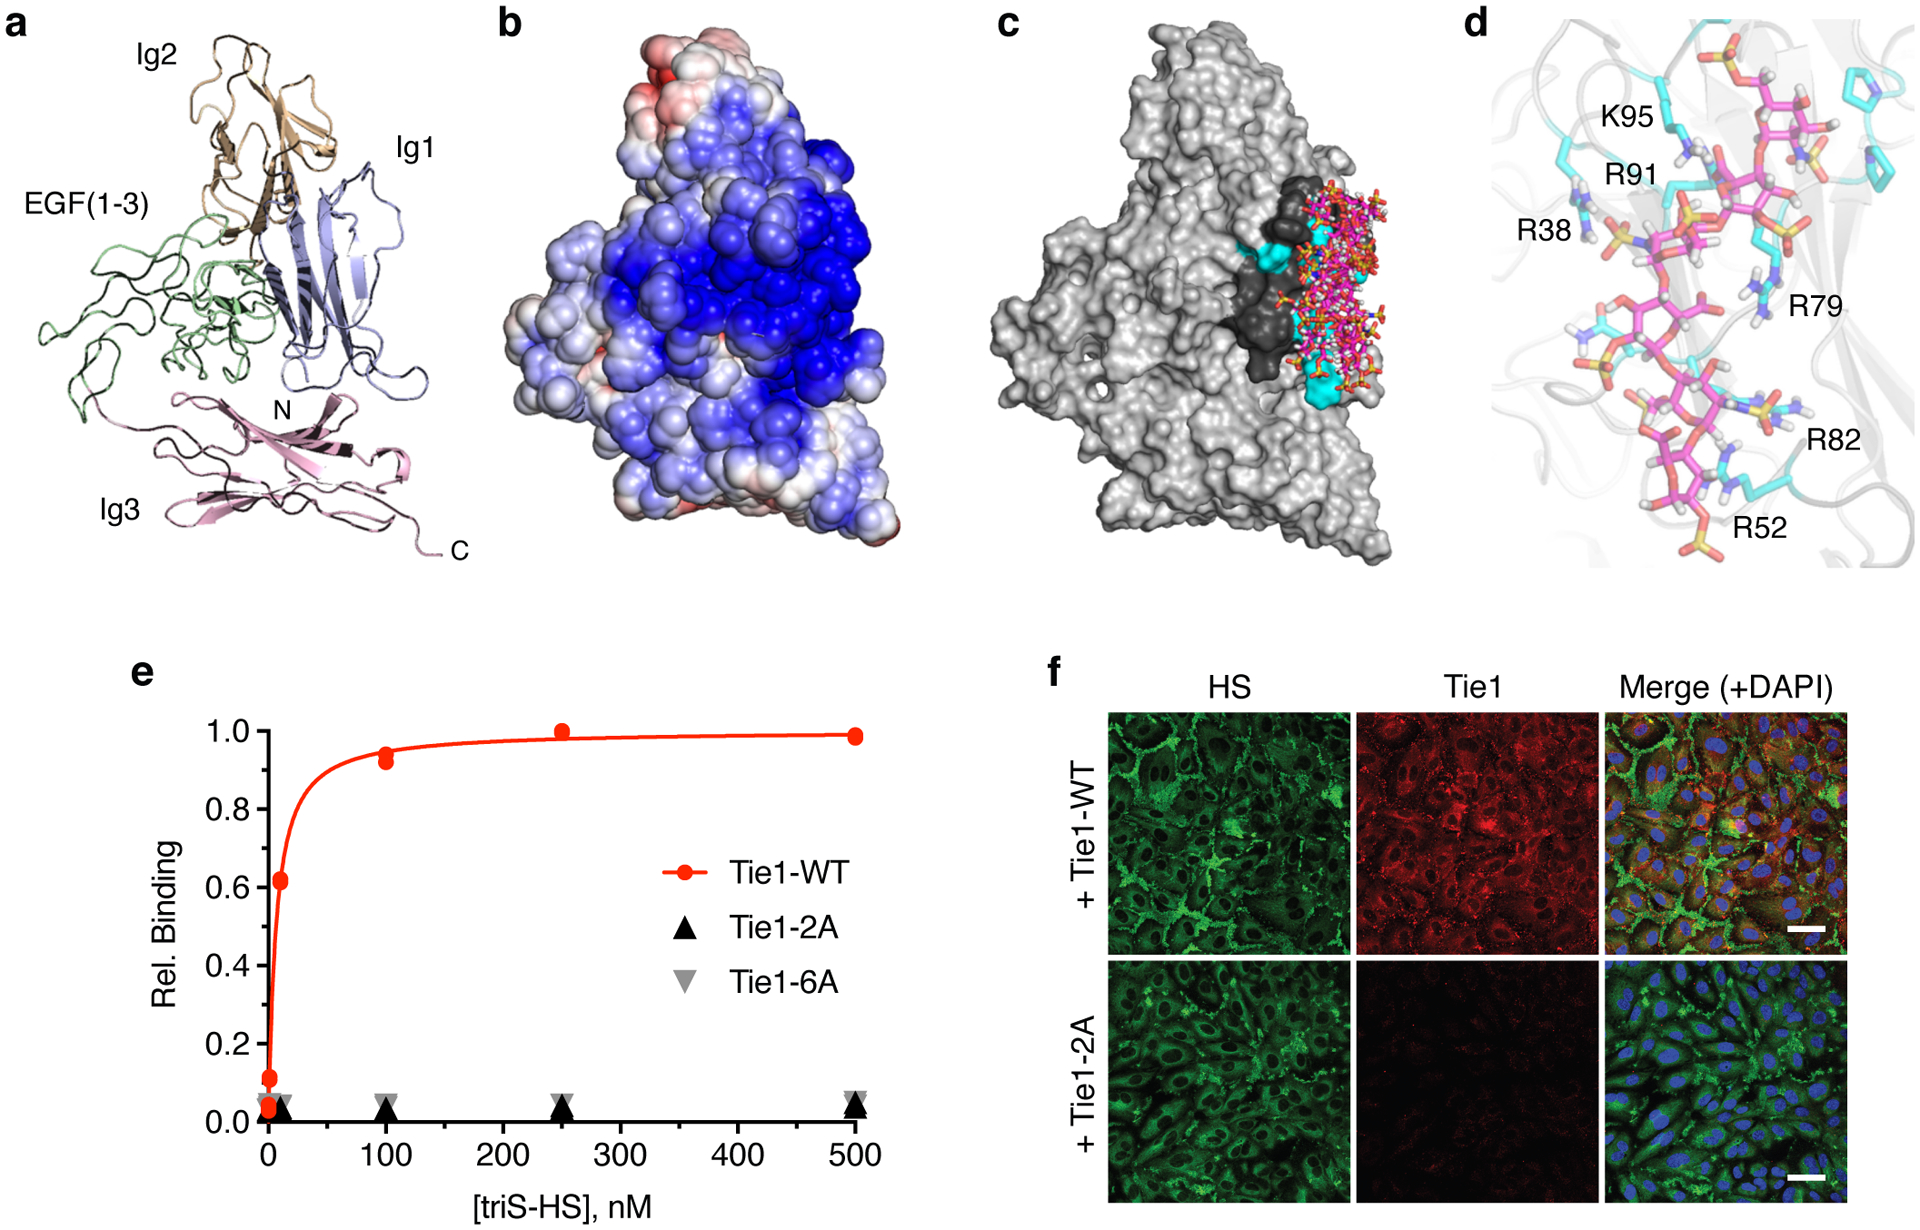
(a) Ribbon diagram and (b) electrostatic potential surface of the N-terminal Tie1 homology model produced by SWISS-MODEL. The red to blue scale in (b) represents relative electrostatic potential (electronegative to electropositive). (c) Superimposed top ten binding poses of triS-HS hexasaccharides (pink), as ranked by calculated binding energies from GAG-Dock. (d) Groove of six electropositive residues within 5–10 Å of the top 10 docked triS-HS hexasaccharide poses. The top ranked pose is shown. (e) Carbohydrate-ELISA binding assay for Tie1-WT and mutants (2A = R38A, R82A; 6A = R38A, R52A, R79A, R82A, R91A, and K95A). Dissociation constant for Tie1-WT: KD,app = 6.51 nM (5.58 to 7.63 nM). Data represent mean (95% CI), n = 2 independent replicates. (f) Immunofluorescence imaging of HUVECs with cell-associated HS GAGs (green) and soluble Tie1-WT or Tie1-2A (red), scale bar = 50 μm. Nuclear staining by DAPI is shown in blue. Images are representative of 3 biologically independent samples.