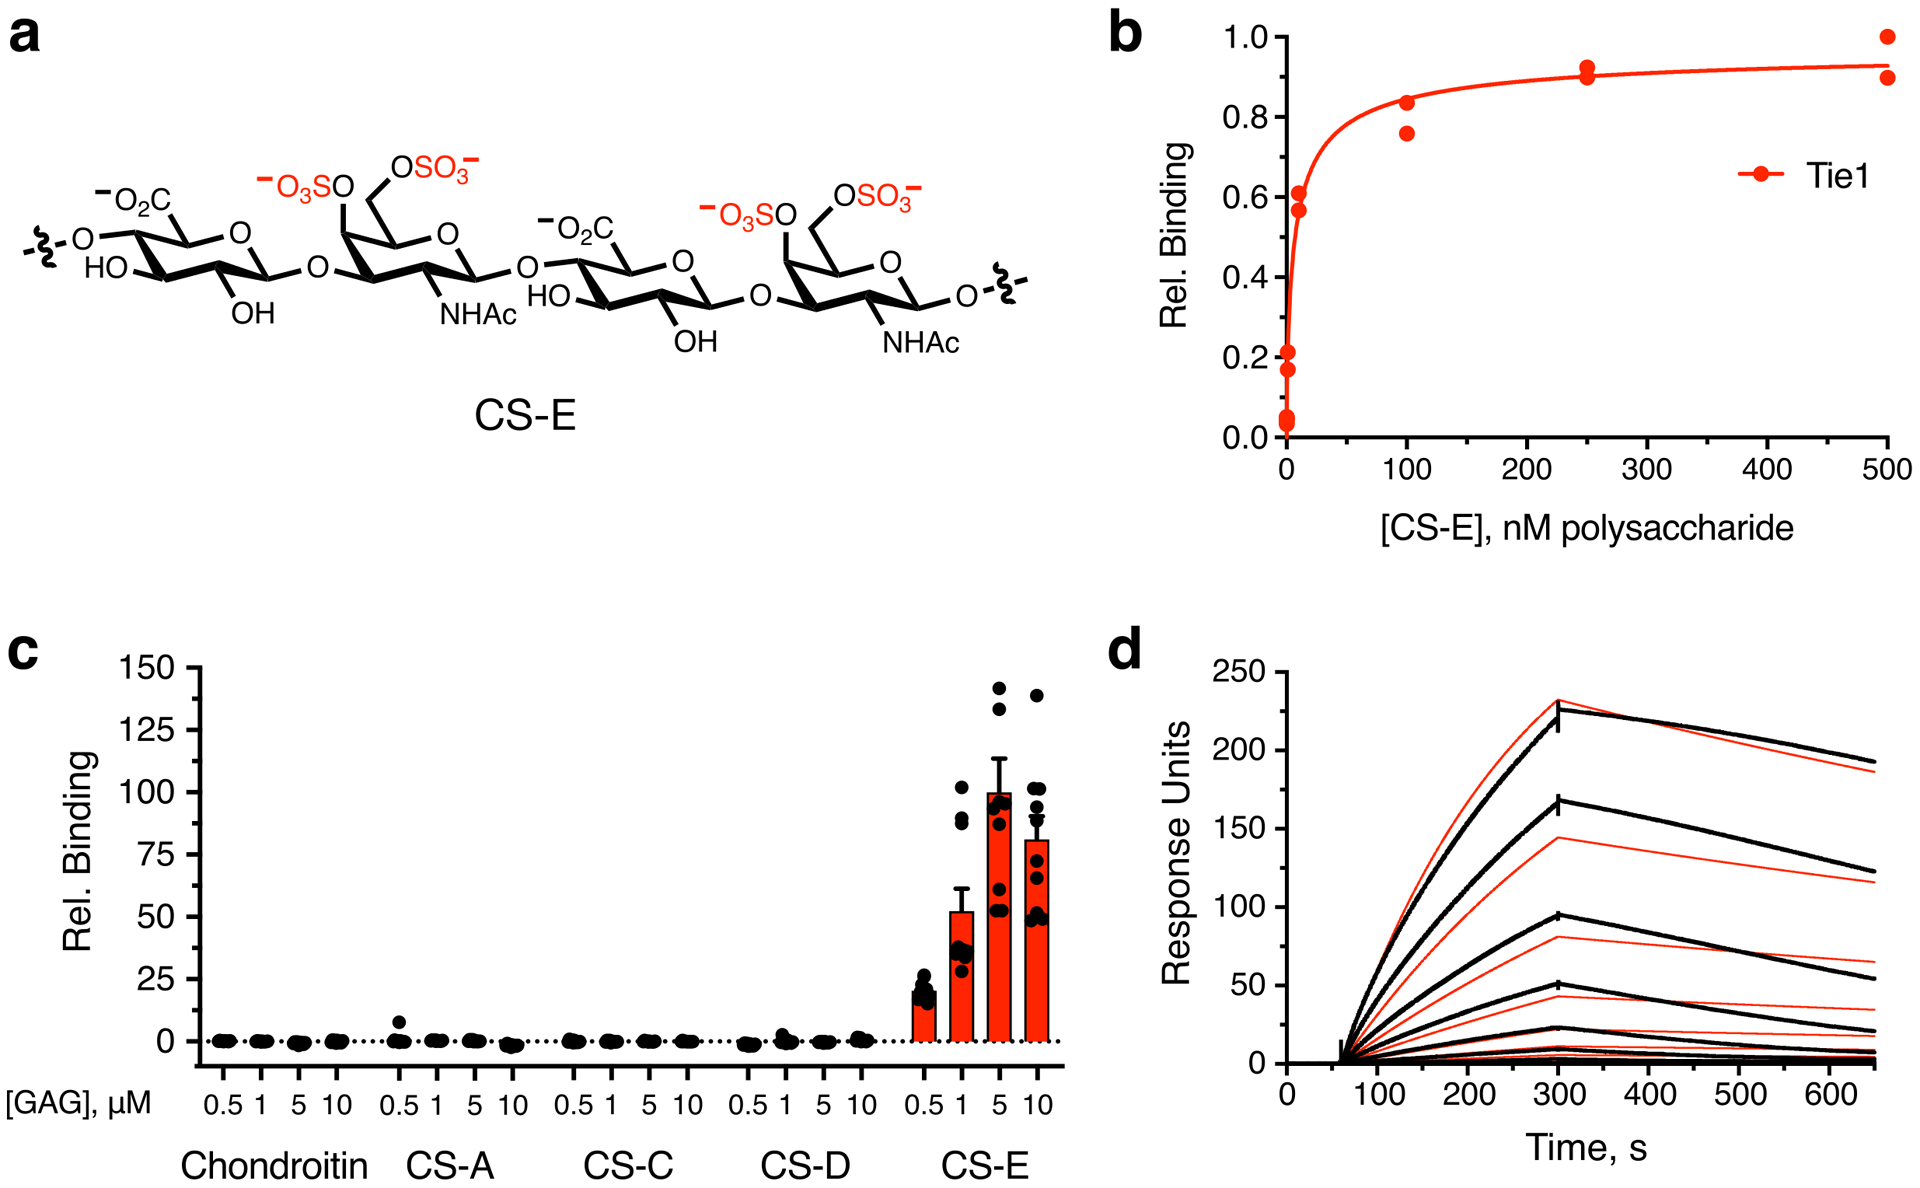
Extended Data Fig. 2. Orphan receptor Tie1 binds to the CS-E motif.

(a) Chemical structure of the CS-E sulfation motif in CS polysaccharides. Interaction of CS-E and Tie1 by (b) ELISA, (c) glycan microarray, and (d) surface plasmon resonance. Dissociation constant for Tie1, as determined by ELISA: KD,app = 19.9 nM (10.5 to 53.5 nM); value represents mean (95% CI); graphed data represent n = 2 independent replicates. For glycan microarrays, data represent mean ± s.e.m., n = 10 individual spots per glycan concentration. Dissociation constant for Tie1, as determined by SPR: KD,app = 14.7 nM (14.6 to 14.8 nM); value represents mean (95% CI). SPR data were fit using a 1:1 Langmuir model shown in red.
