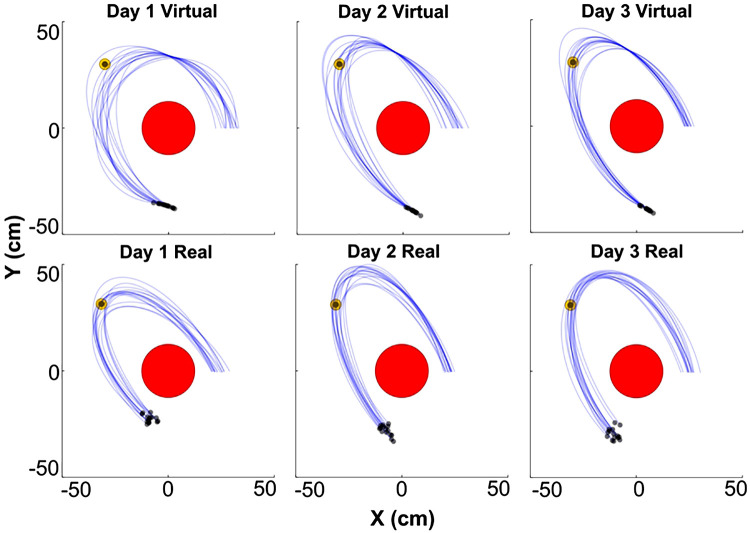
Figure 6.
Ball trajectories of two representative subjects in the virtual (top) and real (bottom) tasks across the 3 days of practice. The blue curves represent 15 ball trajectories from each day, the red circle is the center post, the small yellow circle is the target, and black dots are the release point.

