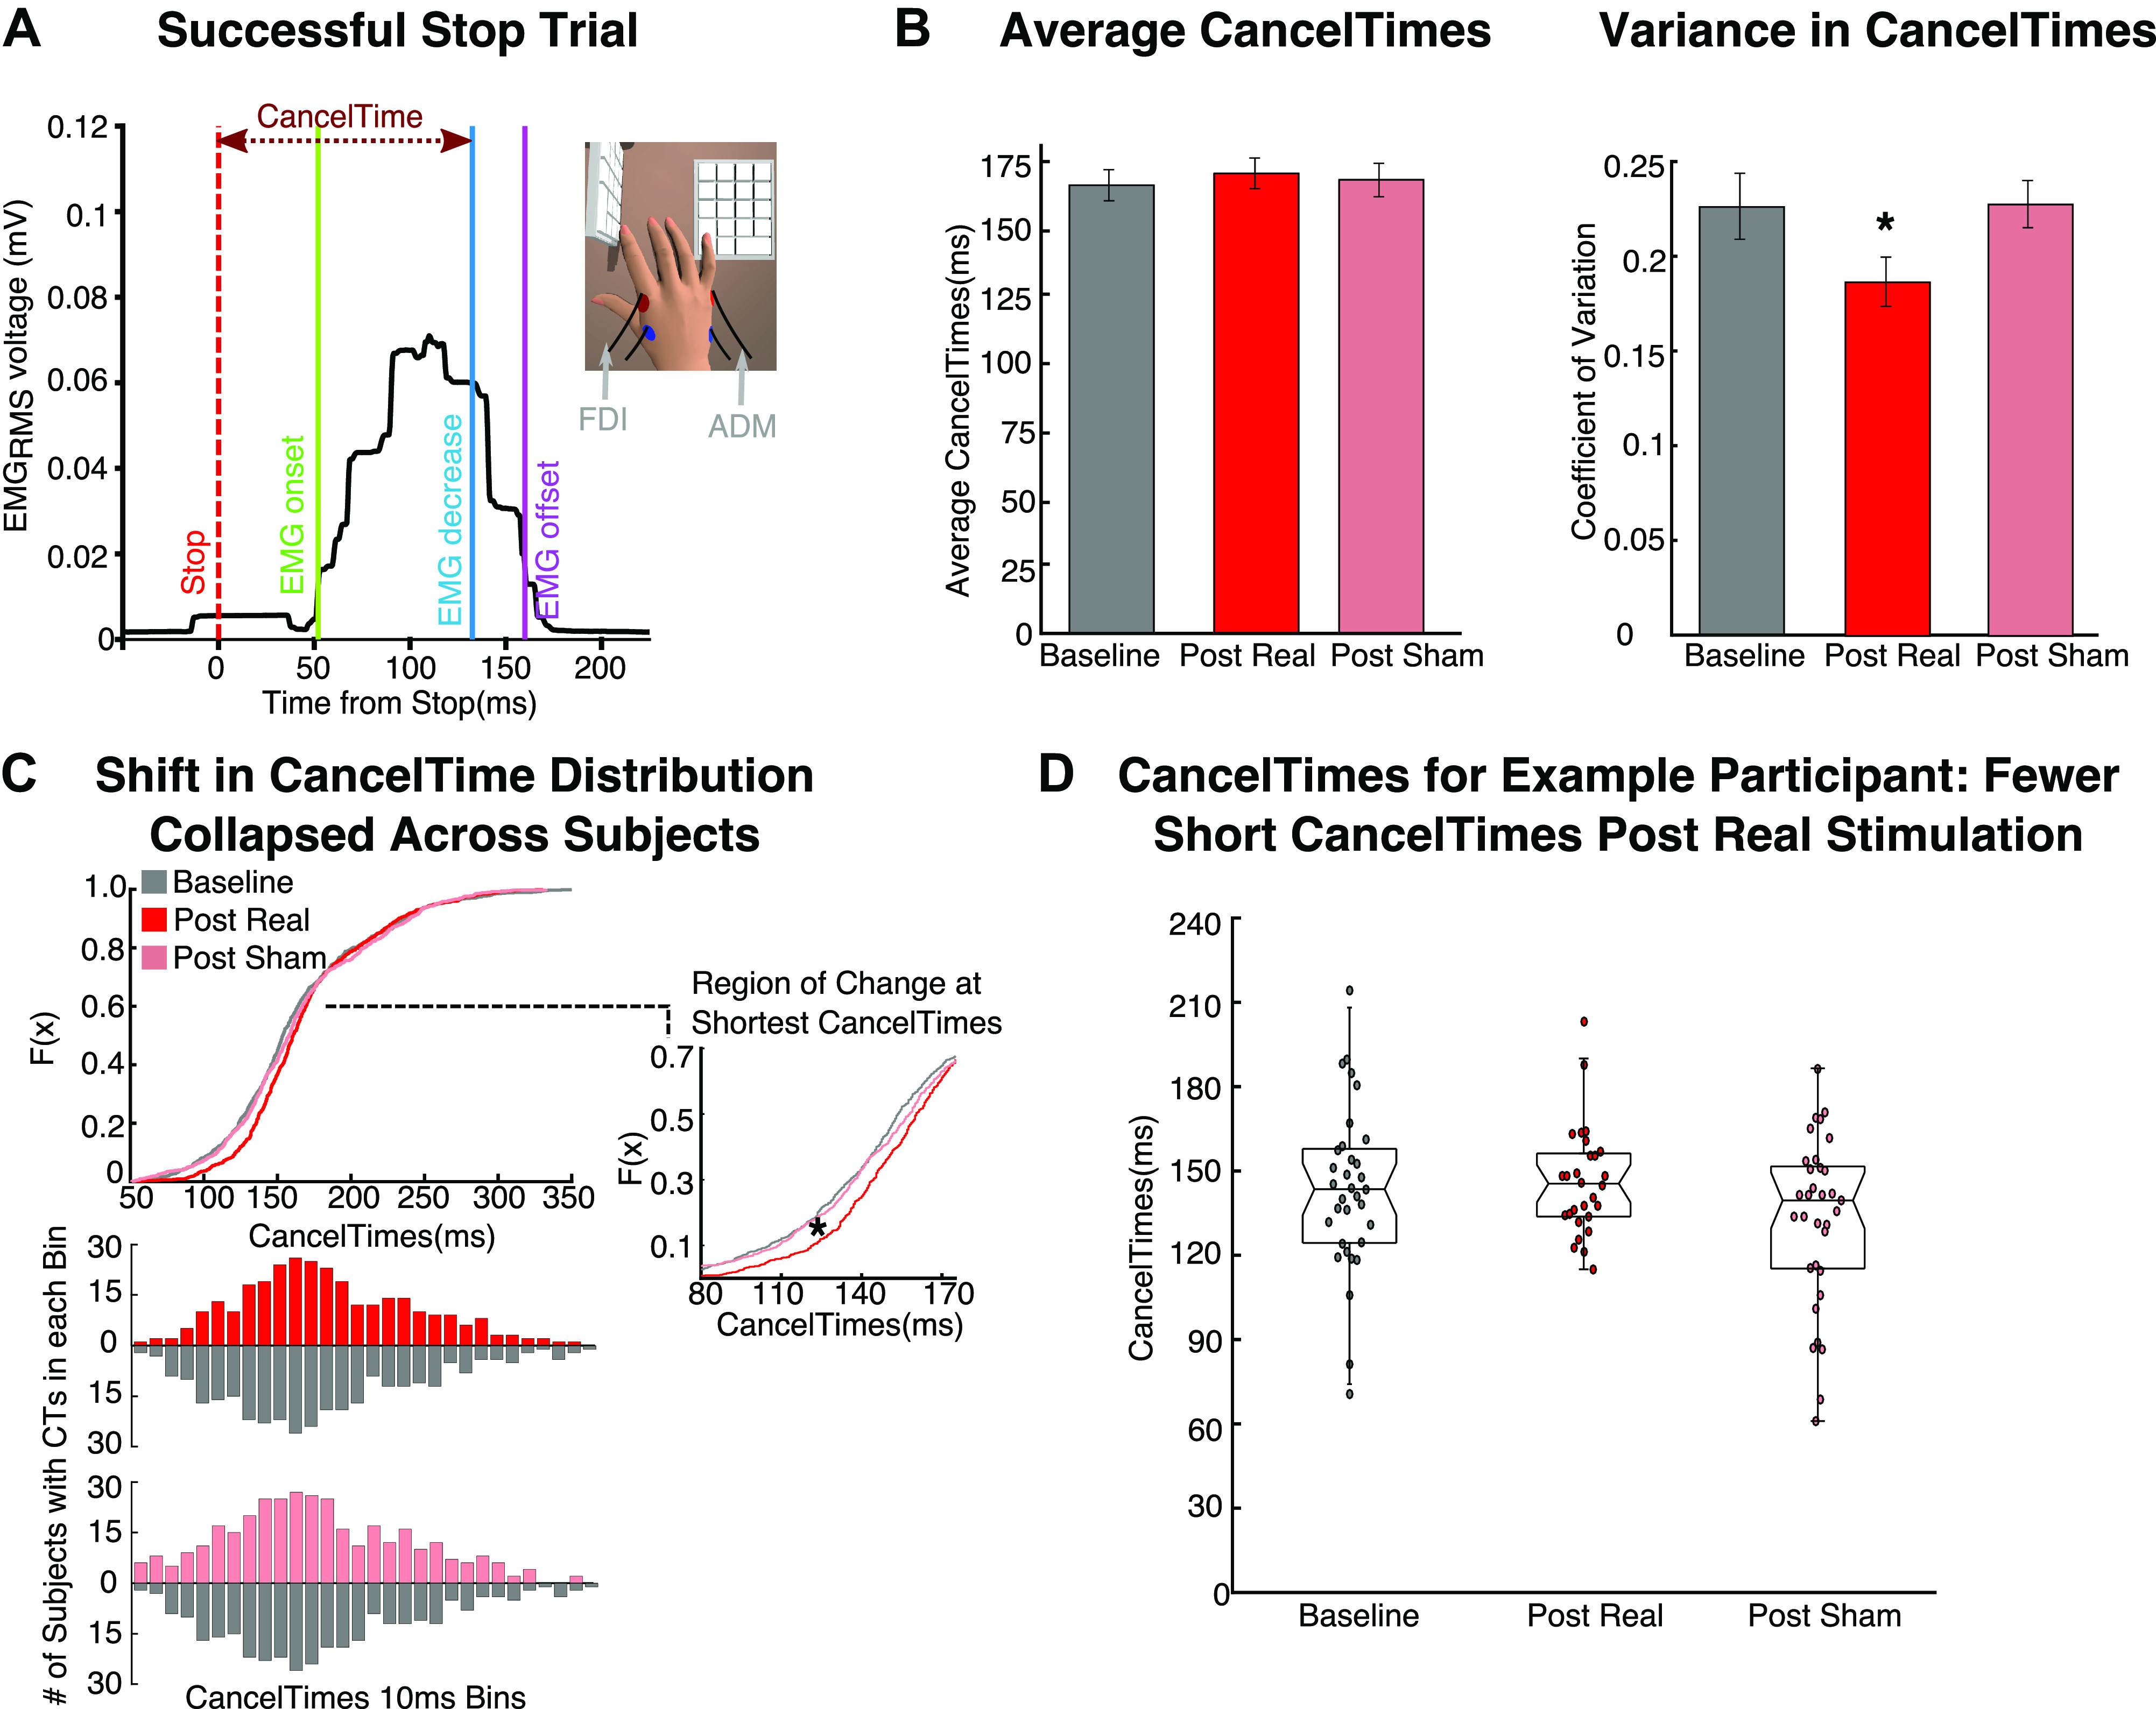
Figure 6.

Analysis of the CancelTime metric of stopping from electromyography. A: example EMG recording from the responding hand on a successful stop trial with partial muscle activity. EMG onset marks the earliest detection of muscle activity after the stop signal. The CancelTime is the point at which EMG activity begins to decrease from the peak activity on trials when the action was successfully canceled. CancelTimes served as an alternative metric of stopping speed. RMS, root mean square. B: there was no difference between sessions in average CancelTimes (left), but there was in CancelTime variability measured by the coefficient of variation (right). C, top: the cumulative distribution function (CDF) illustrates the distribution of CancelTimes for each session (collapsed across all participants). The inset shows the portion of the CDF with a significant shift after real stimulation (i.e., the shortest CancelTimes are less frequent after real stimulation). Bottom: the number of participants contributing to each CancelTime (CT) bin included in the CDF. These data show that fewer participants overall have data points in the earliest CancelTime bins after real stimulation and that the effect on the CDF is not driven by only a few participants. D: example participant illustrating how the shortest CancelTimes are largely abolished after real stimulation.
