Figure 2.
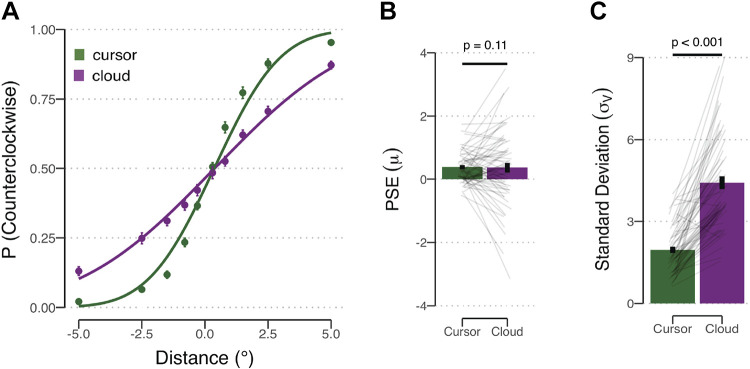
Visual discrimination task. A: proportion of counterclockwise reports as a function of the centroid of the comparison stimulus. Positive values on the x-axis correspond to shifts in the counterclockwise direction. Estimated psychometric functions are the thick lines based on group averaged data for the cursor (green) and cloud (purple) groups. B and C: mean bias and threshold estimates for the cursor and cloud conditions. Error bars represent SE, and thin gray lines represent individuals’ data. P values from within-subject t tests are shown. PSE, point of subjective equality.

