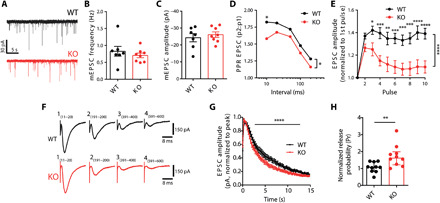
Fig. 7. Increased Pr in hippocampal VAMP4 KO circuits.

Neurotransmission at CA3-CA1 synapses was monitored using whole-cell patch-clamp recording in acute hippocampal slices from wild-type and VAMP4 KO mice. (A) Example mEPSC events. Frequency (B) and amplitude (C) of mEPSC events. n = 7 (wild-type) or n = 8 (KO) slices from four animals, Mann-Whitney test. (D) Paired-pulse ratio (PPR) of EPSCs as a function of the interstimulus interval (10 to 200 ms). n = 17 (wild-type) or n = 15 (KO) slices from either 10 or 9 animals, *P < 0.05, **P < 0.01, ***P < 0.001, ****P < 0.0001, pulse number, two-way ANOVA with Fisher’s least significant difference, *P = 0.027, two-way ANOVA for genotype. (E) Evoked EPSC amplitude for slices stimulated with a 10-AP train (20 Hz, normalized to the first pulse). n = 10 (wild-type) or n = 9 (KO) slices from either seven or six animals, ****P < 0.0001, two-way ANOVA. (F and G) Slices were stimulated with 600 APs (40 Hz). Example EPSC amplitudes (F), average EPSC amplitude (normalized to peak response) (G). n = 10 (both) slices from either 6 or 8 animals, ****P < 0.0001, two-way ANOVA. (H) Pr of the CA3-CA1 synapse in wild-type and VAMP4 KO, calculated by dividing the amplitude of the first evoked EPSC by the effective RRP size. n = 10 (both) slices from either six or eight animals, **P = 0.039, Mann-Whitney test.
