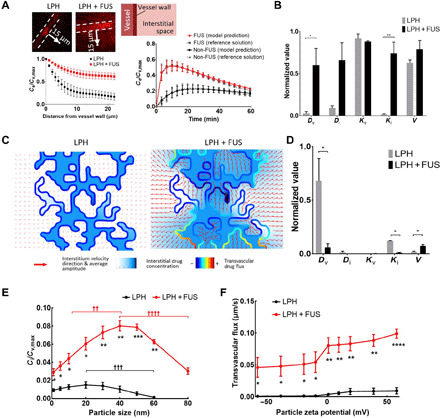
Fig. 6. Integrated quantitative microscopy and PBPK modeling guides the integration of LPH nanoparticles and MB-FUS technologies.

(A) Parameter identification procedures to recover LPH pharmacokinetics from the experimentally determined RhoB-LPH penetration (line profile perpendicular to vessel wall, left) in the GL261 glioma tumor model using 2D tumor cord geometry. The model output and the reference solutions agreed (right). (B) Normalized parameter fit for non–FUS-treated and FUS-treated groups using 2D tumor cord PBPK model. (C) Structurally heterogeneous modeling of LPH transport in TME. (D) Sensitivity analysis of the model parameters. (E) Cellular uptake of LPH with different sizes for non-FUS and FUS. (F) Transvascular flux with different surface charge LPH for non-FUS and FUS. †Difference between different LPH sizes for non-FUS and FUS (one-way ANOVA). *Difference between non-FUS and FUS for each LPH size or surface charge (unpaired t tests). Extracellular LPH concentration (Ce) and intracellular LPH concentration (Ci) normalized to maximum LPH concentration inside the vessel (Cv). Dv, vessel diffusion coefficient; Di, interstitium diffusion coefficient; Kv, vessel hydraulic conductivity; Ki, interstitium hydraulic conductivity; V, rate of endocytosis. The plots show means ± SEM (N = 3). In (B) and (C), the P values were determined by unpaired t tests. *P ≤ 0.05, **P ≤ 0.01, ***P ≤ 0.001, ****P ≤ 0.0001, ††P ≤ 0.01, †††P ≤ 0.001, ††††P ≤ 0.0001.
