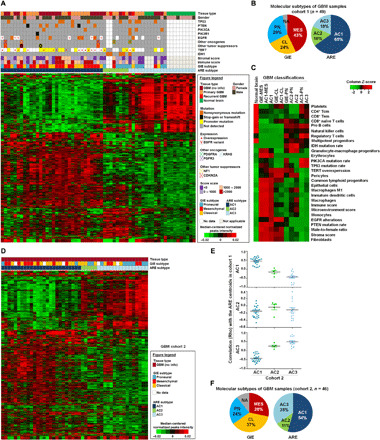
Fig. 1. Landscape and clustering of active regulatory elements in GBM tissues.

(A) Unsupervised hierarchical clustering of 1107 most-varying H3K27ac peaks (mean, ≥10; median absolute deviation, >1) across 49 GBM tissues (cohort 1) and 12 normal brain tissues. Top: The clinical, mutational, and molecular data of each sample. (B) Molecular classification of GBM samples in cohort 1 based on GIE subtypes and ARE subtypes. (C) Heatmap of differential enrichments of immune cell signatures, stromal cell signatures, gene mutations, and clinical parameters among normal brain tissues and various molecular subtypes of GBM. (D) ARE clustering of an independent cohort of 46 GBM samples (cohort 2) based on the same set of 1107 variant elements that were identified from cohort 1. (E) Spearman correlation of ARE status in cohort 2 samples with each subtype centroids of cohort 1. (F) Summary of molecular GIE subtypes and ARE subtypes among cohort 2. AC, active regulatory element-based cluster; ARE, active regulatory element; CL, classical subtype; GIE, GBM-intrinsic gene expression; MES, mesenchymal subtype; PN, proneural subtype.
