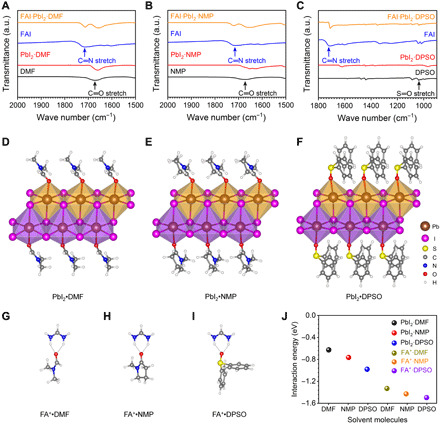
Fig. 2. Interaction between the solvent or additive molecules and perovskite precursor species.

(A to C) FTIR spectra of fingerprint regions for C═O and S═O stretching vibrations. (A) C═O stretching detected from DMF (solution, black), PbI2·DMF (powder, red), FAI (powder, blue), and FAI·PbI2·DMF (powder, orange). (B) C═O stretching detected from NMP (solution, black), PbI2·NMP (powder, red), and FAI·PbI2·NMP (powder, orange). (C) S═O stretching measured for DPSO (powder, black), PbI2·DPSO (powder, red), and FAI·PbI2·DPSO (powder, orange). The blue line represents the spectra of FAI (powder). (D to I) Molecular structures resulting from DFT calculations. Molecular structures of (D) PbI2·DMF, (E) PbI2·NMP, (F) PbI2·DPSO, (G) FA+·DMF, (H) FA+·NMP, and (I) FA+·DPSO. (J) Interaction energy of solvent or additive molecules with the perovskite precursor species FA+ and PbI2.
