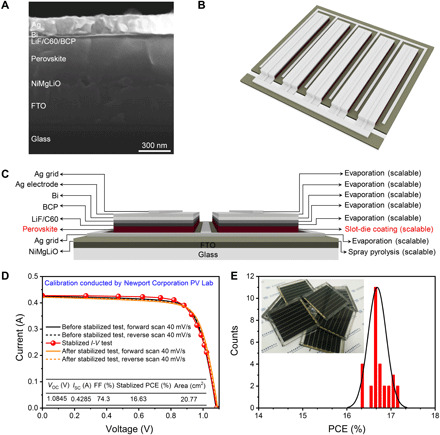
Fig. 5. PSM structure and performance.

(A) High-resolution cross-sectional SEM image of a complete PSM. (B) Three-dimensional structure schematic diagram of the designed module connected in parallel. (C) Cross-sectional schematic illustration of the fabricated module coupled with the deposition methods of the functional layers. (D) I-V curves of PSMs including a stabilized efficiency output and the device performance before and after stabilized test. FF, fill factor. (E) Reproducibility of PSMs (30 samples were tested); the inset is the optical image of some fabricated modules. Photo credit: Zhichun Yang, Huazhong University of Science and Technology.
