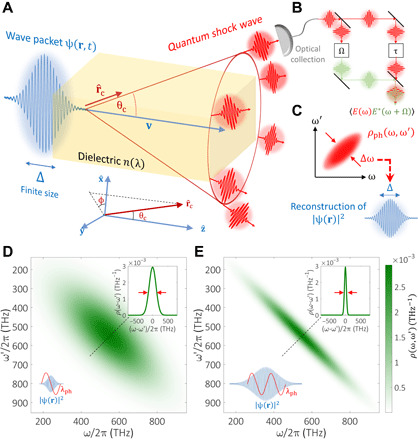
Fig. 3. Quantum optical analysis of CR—for measuring the emitter’s wave function.

(A) A charged particle wave packet ψ(r, t) of finite size Δ and carrier velocity v0 impinges on a Cherenkov detector with material dispersion n(ω). The particle spontaneously emits quantum shock waves of light into a cone with opening half-angle θc(ω) = acos[1/βn(ω)]. Collection optics is situated along the cone in the direction in the far field. (B) Detection scheme for measuring the spectral field autocorrelations ⟨E(ω)E(ω′)⟩ using an interference between spectrally/temporally sheared fields (57). (C) The reconstructed photon density matrix determines the spatial probability distribution ∣ψ(r)∣2. (D and E) Simulation of particle wave function size reconstruction from the photon density matrix. A single 1-MeV electron (β = 0.94) in a silica Cherenkov detector [dispersion taken from (77)] emits CR that is collected within the visible range (λ = 400 to 700 nm, centered at λ0 = 550 nm). The electron wave function envelope is Gaussian and spherically symmetric, with position uncertainty of (d) Δxe = 254 nm and (E) Δxe = 1016 nm (bottom insets). In both (D) and (E), the measured photon density matrix, ρph(ω, ω′), is plotted. The wave function–independent diagonal ρph(ω, ω) that denotes the photodetection probability is the same for both cases. However, the off-diagonal spectral coherence ρph(ω − ω′) is strongly dependent on the wave function. Measuring its width Δωcoh (top insets) and using the approximate Eq. 7 provide the estimates (D) and (E) .
