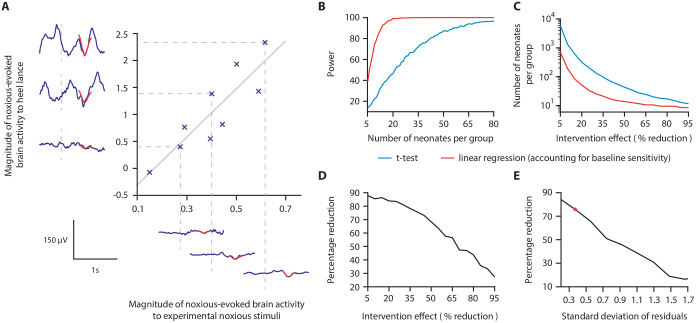
Figure 2. Magnitude of noxious-evoked brain activity in response to experimental noxious stimuli correlates with the response to a clinically required heel lance and can be used as a measure of baseline sensitivity to reduce sample sizes.
(A) The magnitude of noxious-evoked brain activity following mild experimental noxious stimuli and a clinically required heel lance was significantly correlated within-subject (p=0.0025, R2 = 0.77, n = 9, Pearson correlation test, Study 1); grey solid line indicates line of best fit. Dashed lines and their corresponding electroencephalography (EEG) traces indicate three neonates with a range of response magnitudes. The magnitude of the brain activity was quantified using a template of noxious-evoked activity, shown overlaid in red (Hartley et al., 2017). (B-E) In Study 2, we used simulated data to investigate how sample size is altered when the relationship in (A) is considered. (B) For each sample size, 1000 data sets were simulated with a 40% reduction in the response to a clinically required procedure assumed in the Intervention Group. The power (percentage of significant results, p<0.05) to detect a difference between the two groups was calculated for each sample size using a linear regression with (red) and without (blue) accounting for individual differences in baseline sensitivity. (C) The number of neonates required to achieve 95% power with different levels of intervention effect. Simulations were run with increasing numbers of neonates until 95% power was achieved. (D) Percentage reduction in the number of neonates required per group when individual baseline sensitivity is accounted for compared with not accounting for baseline sensitivity (power = 95%). (E) The percentage reduction in the number of neonates required per group with different degrees of correlation (standard deviation of residuals) between the responses to experimental noxious stimuli and clinically required procedure (40% intervention effect, 95% power). The red marker indicates the standard deviation of residuals (SD = 0.37) in (A) (Figure 2—source data 1). The code to produce (B-E) is available from https://gitlab.com/paediatric_neuroimaging/simulating_power_nociceptive_sensitivity.git.

