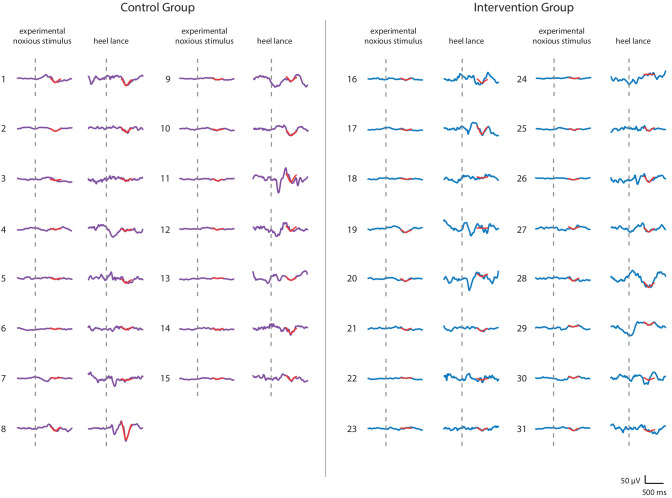
Figure 3. Accounting for individual baseline sensitivity in the assessment of efficacy of a gentle touch intervention.
(A) The magnitude of the noxious-evoked brain activity following a mild experimental noxious stimulus compared with the clinically required heel lance for each neonate in the Control Group (n = 15). Solid line indicates line of best fit. (B) (Top) Group average raw electroencephalography (EEG) and (Woody) filtered EEG traces in response to the clinically required heel lance; Control Group (purple) and Intervention Group (neonates received gentle touch at a rate of approximately 3 cm/s for 10 s prior to the heel lance, n = 16) (blue). Dashed lines indicate the point of stimulation; the template of noxious-evoked brain activity is shown overlaid in red. Each neonate’s EEG responses to the experimental noxious stimulus and the heel lance are shown in Figure 3—figure supplement 1. (Bottom) Magnitude of the noxious-evoked brain activity following heel lance in the two groups. Error bars indicate mean ± standard error. (C) Comparison of the stimulus responses for each neonate in the Intervention Group. Gentle touch was not applied prior to the experimental noxious stimuli so that each neonate’s individual baseline sensitivity could be assessed. (D) Confidence intervals of the correlations for the two groups shown overlaid: Control Group (purple), Intervention Group (blue), solid lines indicate line of best fit. The effect of the intervention (gentle touch) is demonstrated by the difference between the two groups’ confidence intervals and is most evident in neonates who have greater baseline sensitivity (i.e. higher responses to the experimental noxious stimulus) (Figure 3—source data 1).


