. 2021 Apr 13;10:e65266. doi: 10.7554/eLife.65266

Figure 5. Paracetamol significantly reduces noxious-evoked brain activity following immunisation.

(A) Experimental design of Study 4. Electroencephalography (EEG) was recorded during immunisations in neonates before (Control Group, n = 16) and after the guideline change (Intervention Group, n = 16, received paracetamol 1 hr prior to immunisation). A subset of neonates in the Intervention Group (n = 11 of 16) received experimental noxious stimuli before and approximately 1 hr after paracetamol administration. (B) Average (Woody) filtered EEG following immunisations are displayed (top); for the Control Group in purple and Intervention Group in teal, the template of noxious-evoked brain activity is shown overlaid in red. Dashed lines indicate the point of contact of the needle with the skin. The use of the template of noxious-evoked brain activity to quantify the magnitude of noxious-evoked brain activity from immunisation applied to the thigh was validated: Figure 5—figure supplement 1 and Figure 5—figure supplement 2. Individual neonate’s EEG responses to the immunisation are shown in Figure 5—figure supplement 3. (Bottom) Magnitude of the noxious-evoked brain activity following immunisations in the two groups (Control Group n = 15, Intervention Group n = 14), error bars indicate mean ± standard error (linear mixed effects regression model − without accounting for baseline sensitivity, t = 3.61, **p<0.001). (C) Magnitude of the noxious-evoked brain activity following the experimental noxious stimulus prior to paracetamol administration (baseline sensitivity) compared with the noxious-evoked brain activity to immunisation (which was approximately 1 hr after paracetamol administration) for each neonate in the Intervention Group subset (n = 9, markers in teal). For comparison, the confidence interval of the Control Group correlation in Study 3 (i.e. the correlation between the response to experimental noxious stimuli and a heel lance) is shown in grey. (D) Magnitude of the noxious-evoked brain activity to experimental noxious stimuli prior to paracetamol administration (baseline sensitivity) compared with the noxious-evoked brain activity to experimental noxious stimuli applied approximately 1 hr after paracetamol administration for each neonate in the Intervention Group subset (n = 9, markers in teal). For comparison, the confidence interval of the Control Group correlation in Study 3 (i.e. the correlation between the response to experimental noxious stimuli and a heel lance) is shown in grey (Figure 5—source data 1).

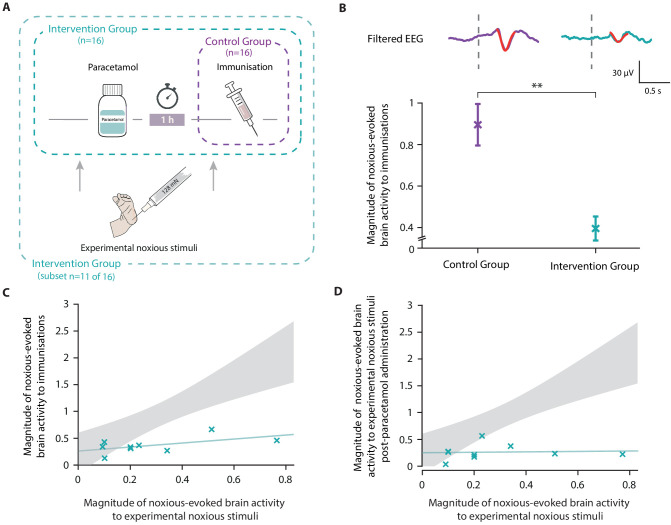
Figure 5—source data 1. Numerical data plotted in Figure 5B,C,D.

Figure 5.

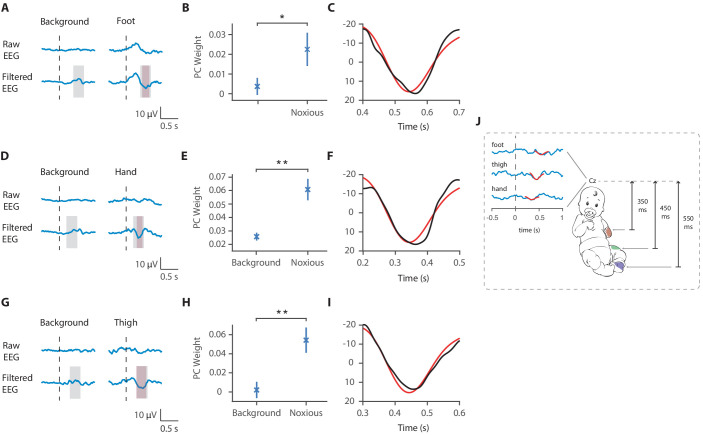
Figure 5—figure supplement 1. Latency of the noxious-evoked brain activity in response to stimulation on the foot, thigh, and hand.

Figure 5—figure supplement 1.

(A) Raw average and Woody filtered electroencephalography (EEG) following experimental noxious stimuli of the foot and during background brain activity. (B) Principal component analysis (PCA) was conducted in the time window 400–700 ms after the stimulus and the second principal component weights were significantly higher to noxious stimulation of the foot compared with in the background brain activity (paired t-test, *p<0.05). (C) The second principal component waveform (black) was highly correlated with the previously described template of noxious-evoked brain activity (red). (D) Raw average and Woody filtered EEG following experimental noxious stimuli of the hand and during background brain activity. (E) PCA was conducted in the time window 200–500 ms after the stimulus and the second principal component weights were significantly higher to noxious stimulation of the hand compared with in the background brain activity (**p<0.001). (F) The second principal component waveform (black) was highly correlated with the previously described template of noxious-evoked brain activity (red). (G) Raw average and Woody filtered EEG following experimental noxious stimuli of the thigh and during background brain activity. (H) PCA was conducted in the time window 300–600 ms after the stimulus and the second principal component weights were significantly higher to noxious stimulation of the thigh compared with in the background brain activity (**p<0.001). (I) The second principal component waveform (black) was highly correlated with the previously described template of noxious-evoked brain activity (red). (J) Schematic representation of the latency of the noxious-evoked brain activity with stimuli applied across different locations. In panels (A,D,G) dashed lines show the timepoint of the stimulation. Pink shading shows the time window of the identified noxious response cluster and grey shading shows the time window where the PCA was performed.
Figure 5—figure supplement 2. Validation of the template for use in immunisation studies.

Figure 5—figure supplement 2.

(A) t-Statistics from the comparison of the noxious-evoked brain activity following immunisations and during background brain activity in 15 neonates from the Control Group in Study 4. Dashed lines indicate the t-statistic threshold for cluster significance, set as the 97.5 percentile of the permuted data. The grey bars indicate time periods outside of the t-statistic threshold and the significant time window identified with the cluster analysis is illustrated by the grey shading area. (B) Principal component analysis was conducted in the time window 300–600 ms after the immunisations and the first principal component weights were significantly higher following immunisations compared with in the background brain activity (*p<0.01). (C) The first principal component waveform (black) was highly correlated with the previously described template of noxious-evoked brain activity (red).
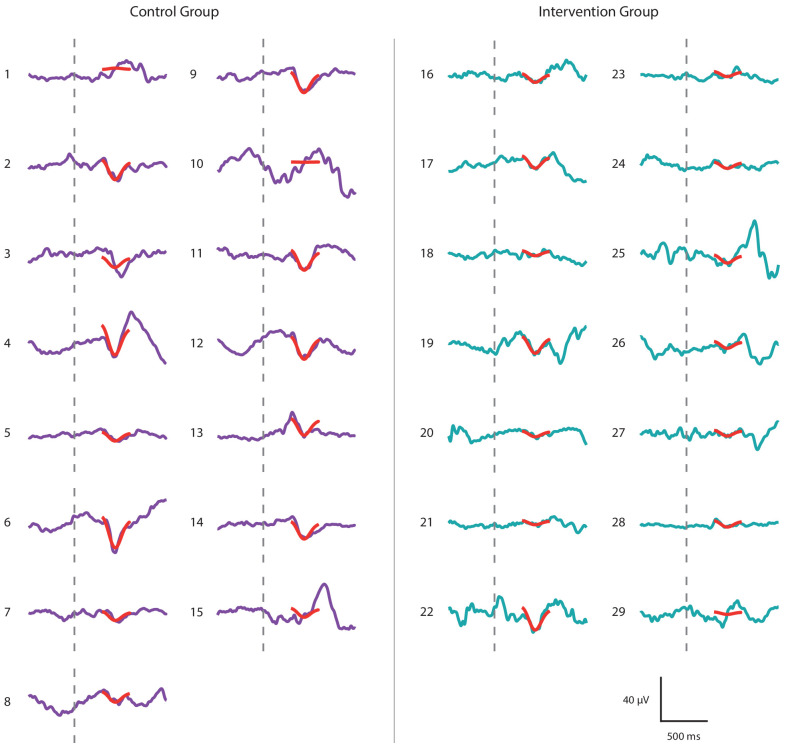
Figure 5—figure supplement 3. Noxious-evoked brain activity following immunisations in individual neonates in the Control Group and Intervention Group, Study 4.

Figure 5—figure supplement 3.

Average noxious-evoked brain activity in individual neonates following immunisations in the 29 neonates in Study 4. The template of noxious-evoked brain activity (Hartley et al., 2017) is overlaid in red and the grey dashed lines indicate the point of stimulation. Neonates in the Intervention Group (electroencephalography [EEG] traces in teal) received paracetamol approximately 1 hr prior to the immunisations.